Copyright
©2006 Baishideng Publishing Group Co.
World J Gastroenterol. Dec 28, 2006; 12(48): 7779-7785
Published online Dec 28, 2006. doi: 10.3748/wjg.v12.i48.7779
Published online Dec 28, 2006. doi: 10.3748/wjg.v12.i48.7779
Figure 1 Clinical outcomes by level of the Rockall risk scoring system.
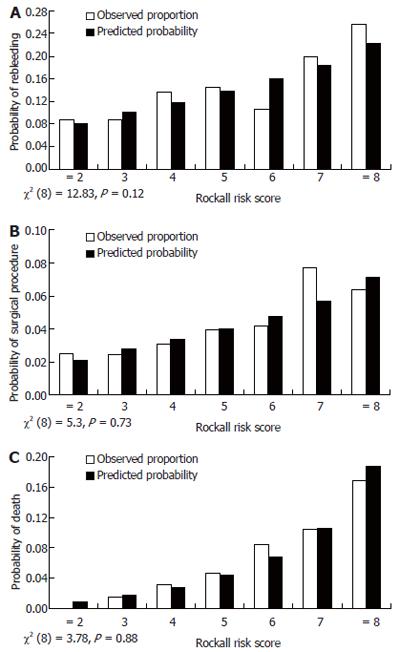
Figure 2 Predicted versus observed outcomes by Rockall risk core.
A: Rebleeding; B: Surgical procedures; C: Death.
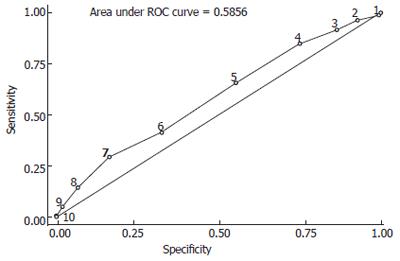
Figure 3 Receiver operating characteristic (ROC) curve for outcome of rebleeding.
Numbers along the curve indicate Rockall risk score cutoff values; The optimal threshold is a Rockall score of 7 (in bold).
Figure 4 Receiver operating characteristic (ROC) curve for outcome of surgical procedure.
Numbers along the curve indicate Rockall risk score cutoff values; The optimal threshold is a Rockall score of 6 (in bold).
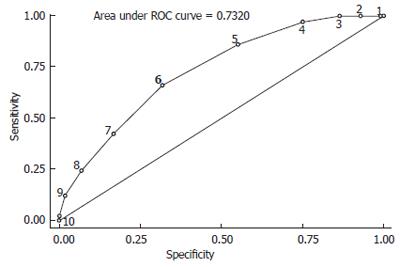
Figure 5 Receiver operating characteristic (ROC) curve for outcome of death.
Numbers along the curve indicate Rockall risk score cutoff values; The optimal threshold is a Rockall score of 6 (in bold).
- Citation: Enns RA, Gagnon YM, Barkun AN, Armstrong D, Gregor JC, Fedorak RN, Group RI. Validation of the Rockall scoring system for outcomes from non-variceal upper gastrointestinal bleeding in a Canadian setting. World J Gastroenterol 2006; 12(48): 7779-7785
- URL: https://www.wjgnet.com/1007-9327/full/v12/i48/7779.htm
- DOI: https://dx.doi.org/10.3748/wjg.v12.i48.7779


