Copyright
©2006 Baishideng Publishing Group Co.
World J Gastroenterol. Dec 7, 2006; 12(45): 7350-7354
Published online Dec 7, 2006. doi: 10.3748/wjg.v12.i45.7350
Published online Dec 7, 2006. doi: 10.3748/wjg.v12.i45.7350
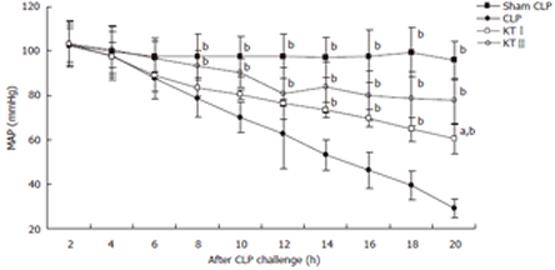
Figure 1 Changes of MAP (mean ± SD).
Closed squares, sham CLP group; Closed circles, CLP group; open squares, ketamine Igroup; open circles, ketamineIIgroup, bP < 0.01 vs CLP group, aP < 0.05 vs ketamine IIgroup.
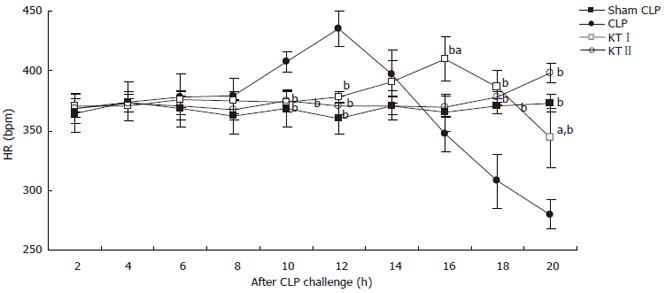
Figure 2 Changes of plasma TNF-α (mean ± SD).
Closed squares, sham CLP group; Closed circles, CLP group; Open squares, ketamineI group; Open circles, ketamineIIgroup, bP < 0.01 vs CLP group, aP < 0.05 vs ketamineIIgroup.
Figure 3 Hepatic NF-κB activation.
- Citation: Song XM, Li JG, Wang YL, Zhou Q, Du ZH, Jia BH, Ke JJ. Effects of ketamine on proinflammatory cytokines and nuclear factor kappaB in polymicrobial sepsis rats. World J Gastroenterol 2006; 12(45): 7350-7354
- URL: https://www.wjgnet.com/1007-9327/full/v12/i45/7350.htm
- DOI: https://dx.doi.org/10.3748/wjg.v12.i45.7350


