Copyright
©2006 Baishideng Publishing Group Co.
World J Gastroenterol. Nov 28, 2006; 12(44): 7126-7135
Published online Nov 28, 2006. doi: 10.3748/wjg.v12.i44.7126
Published online Nov 28, 2006. doi: 10.3748/wjg.v12.i44.7126
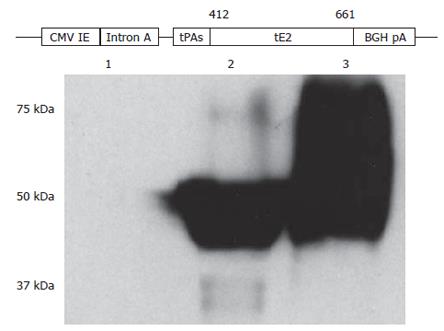
Figure 1 Construction and characterization of HCV E2 DNA vaccine.
A secreted form of HCV E2 protein generated by removing the carboxyl-terminal hydrophobic region and replacing the hypervariable region 1 with the signal peptide sequence of the tissue plasminogen activator (tPAs) was cloned into a DNA vaccine vector pBISIA24. The construction of E2 DNA vaccine, pBISIA24-tPAs-tE2, is schematically presented. TE 671 cells were transfected with pBISIA24 (lane 1) or pBISIA24-tPAs-tE2 (lanes 2 and 3). Cell lysates (lanes 1 and 2) and culture medium (lane 3) were analyzed in immunoblotting using an E2-specific antibody.
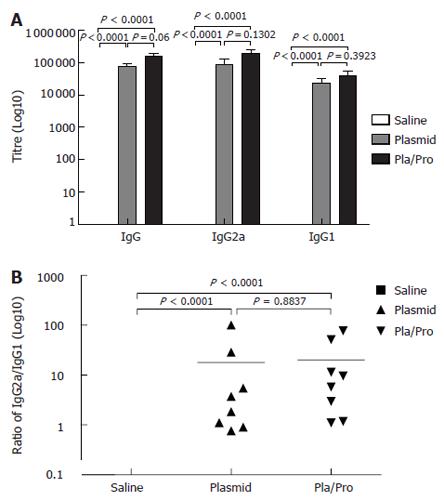
Figure 2 Antibody responses to HCV E2 vaccines in mice.
B6C3F1 mice were intradermally injected with pBISIA24-tPAs-tE2 three times or pBISIA24-tPAs-tE2 twice followed by subcutaneous vaccination with E2 protein formulated with CpG ODN 1826 and 10% Emulsigen at 3-wk intervals. E2-specific IgG, IgG1, and IgG2a levels were determined by ELISA assays (A). The ratios of IgG2a to IgG1 were determined (B) (P < 0.0001, vs saline).
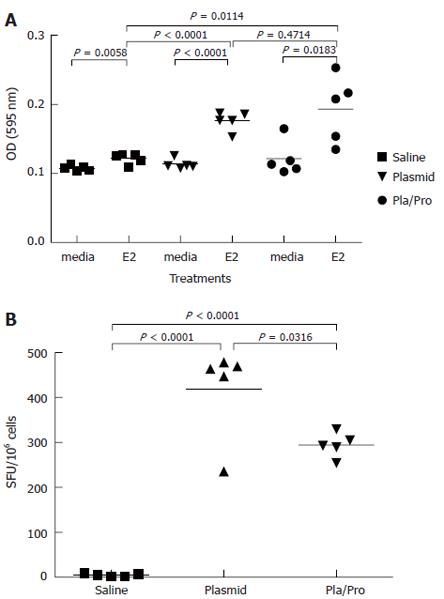
Figure 3 Cell-mediated immune responses to HCV E2 vaccines in mice.
Murine splenocytes were isolated 2 wk after last immunization and were re-stimulated with E2 protein. Cell proliferation was analyzed by MTT assay (A). (P < 0.0001 vs saline; P < 0.05, P < 0.01 vs media). The number of interferon-γ secreting cells was determined by ELISPOT assay (B). (P < 0.05 vs plasmid; P < 0.0001 vs saline).
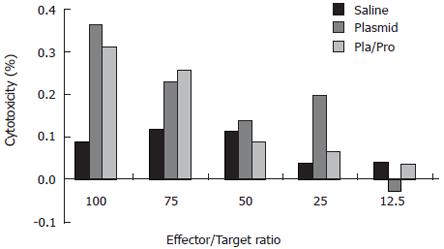
Figure 4 Cytotoxic T lymphocyte (CTL) response to HCV E2 vaccines in mice.
Murine splenocytes isolated from groups of mice two weeks after final immunization were pooled and stimulated with feeder cells infected with recombinant vaccinia virus expressing HCV E2 protein. The cytotoxic activity was determined by measuring the released lactate dehydrogenase (LDH) by the target cells after incubation with the effectors at different ratios.
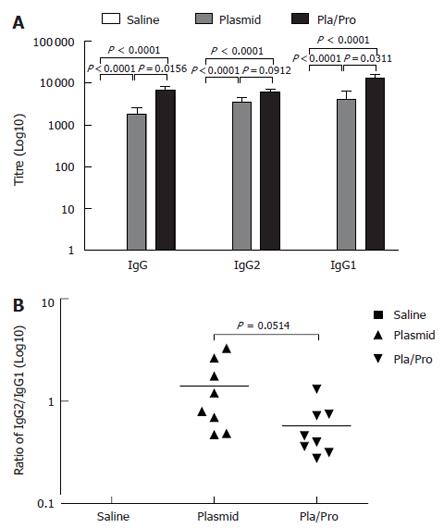
Figure 5 Antibody responses of piglets to HCV E2 vaccines.
Piglets were immunized by saline, E2 DNA vaccine three times, or E2 DNA vaccine twice followed by subcutaneous vaccination with E2 protein formulated with CpG ODN 2007 and 10% Emulsigen at three-week intervals. ELISA assays were performed to determine E2-specific IgG, IgG1, and IgG2 levels (A), as well as the ratios of IgG2 to IgG1 (B) (P < 0.05 vs plasmid; P < 0.0001 vs saline).
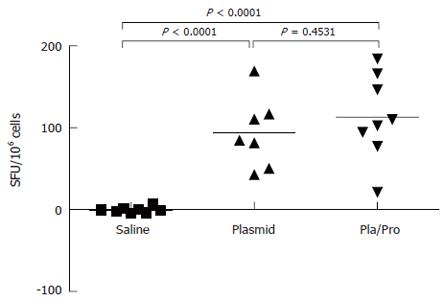
Figure 6 Cell-mediated immune response of piglets to HCV E2 vaccines.
Porcine peripheral blood mononuclear cells (PBMCs) were isolated three weeks after final immunization. After re-stimulation with E2 antigen, the number of interferon-γ secreting cells was determined by ELISPOT assay (P < 0.0001 vs saline).
- Citation: Li YP, Kang HN, Babiuk LA, Liu Q. Elicitation of strong immune responses by a DNA vaccine expressing a secreted form of hepatitis C virus envelope protein E2 in murine and porcine animal models. World J Gastroenterol 2006; 12(44): 7126-7135
- URL: https://www.wjgnet.com/1007-9327/full/v12/i44/7126.htm
- DOI: https://dx.doi.org/10.3748/wjg.v12.i44.7126


