Copyright
©2006 Baishideng Publishing Group Co.
World J Gastroenterol. Nov 28, 2006; 12(44): 7118-7125
Published online Nov 28, 2006. doi: 10.3748/wjg.v12.i44.7118
Published online Nov 28, 2006. doi: 10.3748/wjg.v12.i44.7118
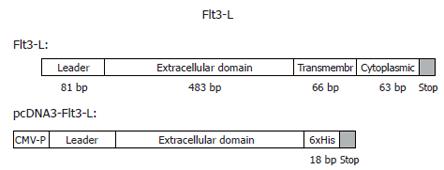
Figure 1 Cloning of the soluble form of mouse Flt3-L containing the leader and the extracellular domain into a mammalian expression vector with CMV-promoter and RSV-enhancer.
The C-terminus was tagged with a 6xHis. The soluble form of mFlt3-L is fully active.
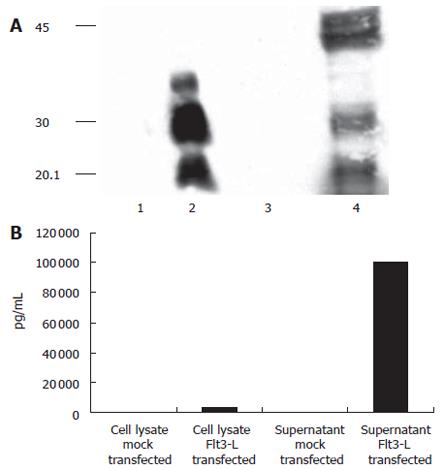
Figure 2 Expression of Flt3-L in transiently transfected HuH-7 cells: (A) Detection of mouse Flt3-L on a 150 g/L SDS-PAGE using an anti-His-Tag antibody.
Different glycosylation forms of Flt3-L in cell were detected in cell lysates and supernatants. Lane 1 and 3: mock-transfected cells; lane 2 and 4: Flt3-L-transfected cells; lane 1 and 2: supernatants after transient transfection; lane 3 and 4: cell lysates. (B) To confirm these results, supernatants and cell lysates were incubated by an Flt3-L-specific ELISA. Again, secretion levels into the supernatant were more than 20-fold higher compared to levels seen in the cell compartment.
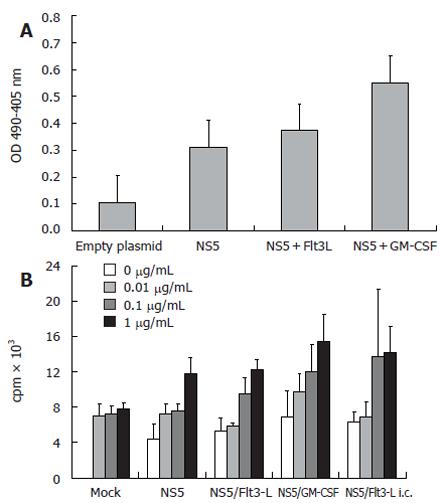
Figure 3 A: Anti-HCV NS5 ELISA showing mean levels of specific antibodies after genetic immunization with HCV-NS5-expressing plasmid.
Controls included wells coated with BSA and sera derived from mock-immunized mice. Each group comprised 10 BALB/c mice and mice sera were pooled before the assay. ELISA plates were coated with HCV-NS5-4, therefore, antibody levels may be underestimated; B: T-cell proliferation assay (n = 10 mice/group) with different amounts of stimulating recombinant HCV NS5-4 protein (0.01-1 µg/mL). An increase of thymidine incorporation was seen after stimulation with 0.1 and 1 µg/mL recombinant protein. However, levels of T-cell proliferation after co-immunization with Flt3-L were only slightly higher than in NS5-immunized mice. Note that stimulation with a non-relevant protein (HBsAg) induced only background activity, demonstrating the antigen specificity (data not shown).
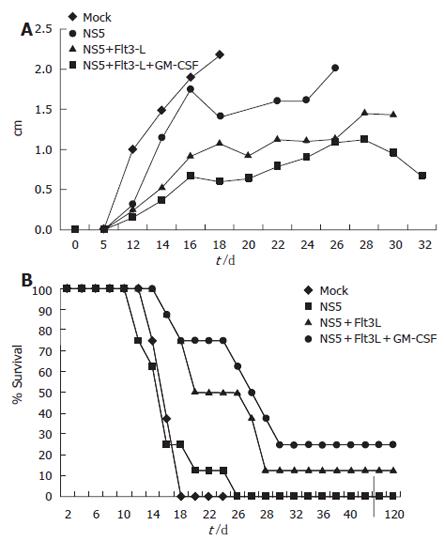
Figure 4 Tumor model to assess CTL activity generated in vivo after genetic vaccination.
Mice were immunized three times with a total of 100 μg of plasmid DNA. Each vaccination group (n = 8) was challenged with 2 × 10⁶ syngenic mouse myeloma cells stably expressing HCV-NS5 protein in the right flank. Mice developed notable tumors around d 8-10. (A) Tumor size in different immunization groups. Note that mice had to be sacrificed at maximum tumor diameter size of 2 cm. Sacrificed mice were then taken out from the measurement. (B) Mouse survival after genetic vaccination in each group. Three mice were long-term survivor and never developed significant tumor burden.
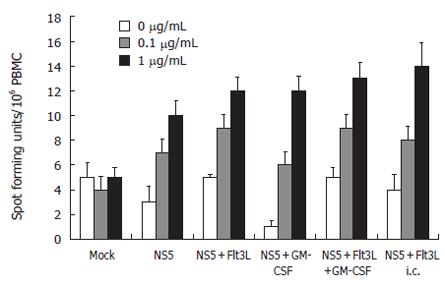
Figure 5 ELISPOT assay: Assessment at the individual single cell level of the number of mIFN-γ-secreting cells as means of CD8 T cell function.
Spleen cells were stimulated with recombinant HCV-NS5 protein at 0.1 and 1 µg/mL, and the number of spot forming units/106 PBMC was counted after 24 h incubation period (n = 10 mice/group). Note that lymphocytes were not restimulated in NS5-expressing cells.
- Citation: Encke J, Bernardin J, Geib J, Barbakadze G, Bujdoso R, Stremmel W. Genetic vaccination with Flt3-L and GM-CSF as adjuvants: Enhancement of cellular and humoral immune responses that results in protective immunity in a murine model of hepatitis C virus infection. World J Gastroenterol 2006; 12(44): 7118-7125
- URL: https://www.wjgnet.com/1007-9327/full/v12/i44/7118.htm
- DOI: https://dx.doi.org/10.3748/wjg.v12.i44.7118


