Copyright
©2006 Baishideng Publishing Group Co.
World J Gastroenterol. Nov 21, 2006; 12(43): 6982-6991
Published online Nov 21, 2006. doi: 10.3748/wjg.v12.i43.6982
Published online Nov 21, 2006. doi: 10.3748/wjg.v12.i43.6982
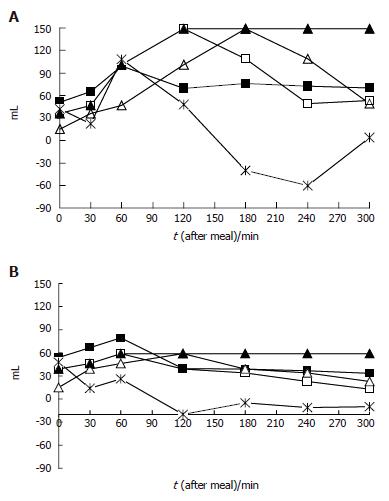
Figure 1 Antral volume measurements and their transformations.
A: Patients referring postprandial drowsiness during the study period; B: Patients not referring symptoms during the study period. Open quadrangle: current antral volume; asterisk: antral volume delta variation between two consecutive measurements; Closed quadrangle: mean weighted antral volume; Closed triangle: maximal antral volume; Open triangle: antral volume value at the preceding time intervals.
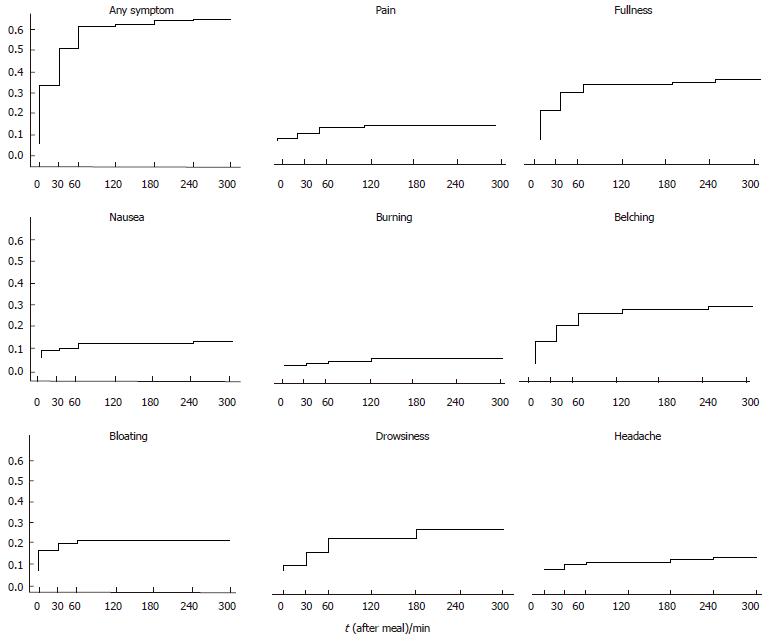
Figure 2 Kaplan-Meier survival curves showing the cumulative probability to develop the evaluated symptoms.
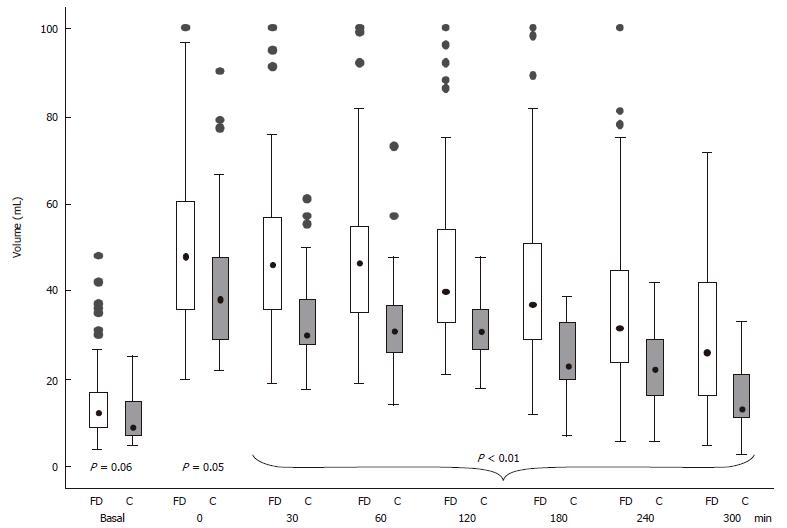
Figure 3 Box-and-whiskers plots of gastric antral volume before (fasting), immediately (0), at 30 and at 60 min intervals, after the end of the ingestion of a standard meal in controls (gray box) and in dyspeptic (white box).
The boxes at each time unit extend from the 25th percentile (x[25]) to the 75th percentile (x[75]) [i.e., the interquartile range (IQ)]; the lines inside the boxes represent the median values. The lines emerging from the boxes (i.e., the “whiskers”) extend to the upper and lower adjacent values. The upper adjacent value is defined as the largest data point ≤ x[75] + 1.5 × IQ, and the lower adjacent value is defined as the smallest data point ≥ x[25] - 1.5 × IQ. Observed values more extreme than the adjacent values, if any, are individually plotted (circles).
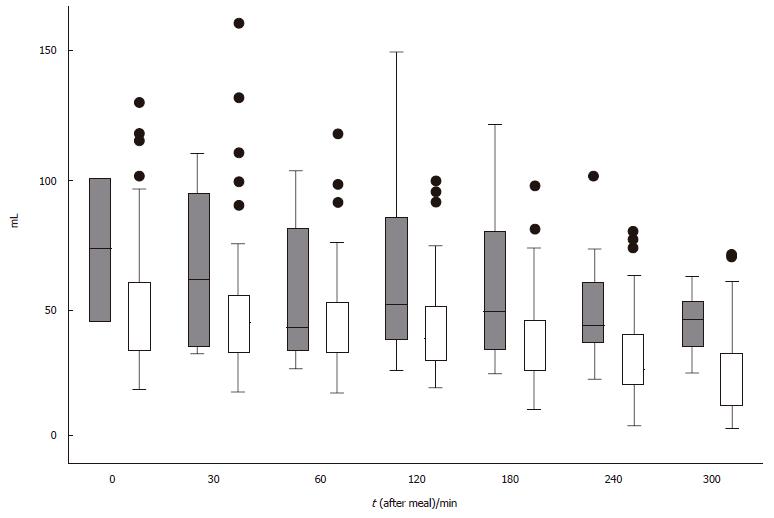
Figure 4 Box-and-whiskers plots of gastric antral volume immediately (0), at 30 and at 60 min intervals, after the end of the ingestion of a standard meal in FD patients with (gray box) and without (white box) postprandial drowsiness.
The boxes at each time unit extend from the 25th percentile (x[25]) to the 75th percentile (x[75]) [i.e., the interquartile range (IQ)]; the lines inside the boxes represent the median values. The lines emerging from the boxes (i.e., the “whiskers”) extend to the upper and lower adjacent values. The upper adjacent value is defined as the largest data point≤ x[75] + 1.5 × IQ, and the lower adjacent value is defined as the smallest data point ≥ x[25] - 1.5 × IQ. Observed values more extreme than the adjacent values, if any, are individually plotted (circles).
- Citation: Pallotta N, Pezzotti P, Corazziari E. Relationship between antral distension and postprandial symptoms in functional dyspepsia. World J Gastroenterol 2006; 12(43): 6982-6991
- URL: https://www.wjgnet.com/1007-9327/full/v12/i43/6982.htm
- DOI: https://dx.doi.org/10.3748/wjg.v12.i43.6982


