Copyright
©2006 Baishideng Publishing Group Co.
World J Gastroenterol. Nov 21, 2006; 12(43): 6949-6954
Published online Nov 21, 2006. doi: 10.3748/wjg.v12.i43.6949
Published online Nov 21, 2006. doi: 10.3748/wjg.v12.i43.6949
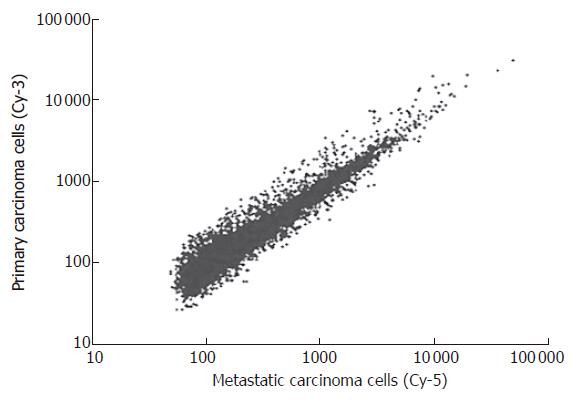
Figure 1 Scatter plots of cDNA microarray analysis.
Primary carcinoma cells and lymph node metastatic cells from 58 patients (TNM stage III-IV) with gastric cancer were labeled by Cy-3 and Cy-5 respectively, and hybridized to the cDNA microarray using laser microdissection in combination with microarray.
Figure 2 Immunohistochemical staining of OPCML.
A: Normal gastric epithelium showing abundant and strong immunoreactivity; B: Primary gastric cancer demonstrating weak immunoreactivity; C: lymph node metastastasis showing rare immunoreactivity (× 400).
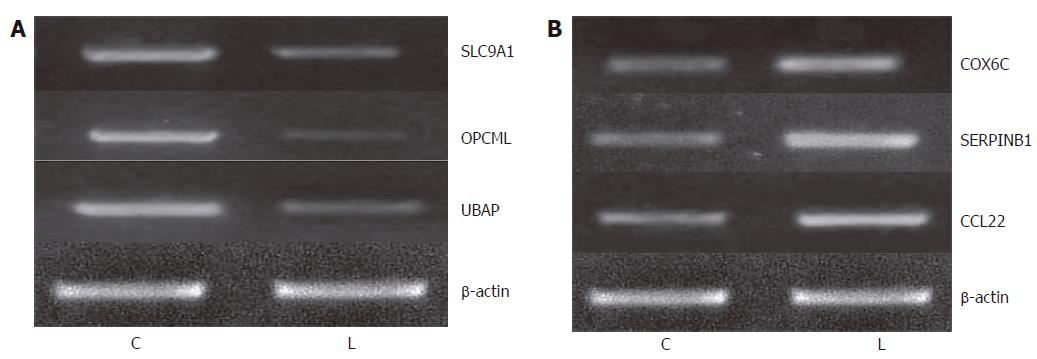
Figure 3 Validation of microarray data by semiquantitative RT-PCR.
A: Expression levels of 3 genes (SLC9A1, OPCML and UBAP) was up-regulated in primary carcinoma; B: Expression of 3 genes (COX6C, SERPINB1 and CCL22) was down-regulated in primary carcinoma. C: A sample from the primary carcinoma cells; L: A sample from the metastatic gastric carcinoma cells.
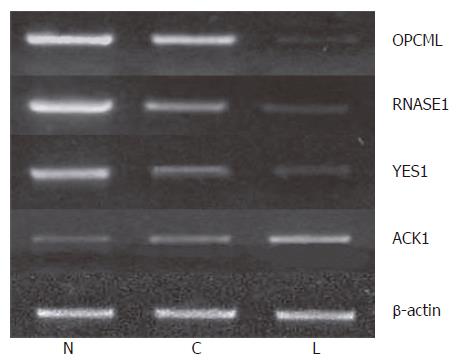
Figure 4 Identification of differentially expressed genes in progrssive gastric cancer by semiquantitative RT-PCR.
N: A sample from normal gastric epithelium; C: Signifies a sample from the primary carcinoma cells; and L: A sample from the metastatic carcinoma cells.
- Citation: Wang L, Zhu JS, Song MQ, Chen GQ, Chen JL. Comparison of gene expression profiles between primary tumor and metastatic lesions in gastric cancer patients using laser microdissection and cDNA microarray. World J Gastroenterol 2006; 12(43): 6949-6954
- URL: https://www.wjgnet.com/1007-9327/full/v12/i43/6949.htm
- DOI: https://dx.doi.org/10.3748/wjg.v12.i43.6949


