Copyright
©2006 Baishideng Publishing Group Co.
World J Gastroenterol. Nov 14, 2006; 12(42): 6828-6834
Published online Nov 14, 2006. doi: 10.3748/wjg.v12.i42.6828
Published online Nov 14, 2006. doi: 10.3748/wjg.v12.i42.6828
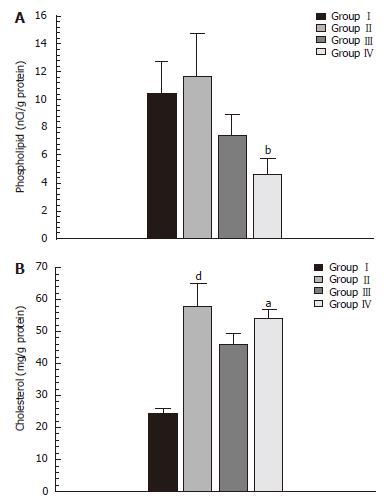
Figure 1 Liver synthesis of phospholipids and cholesterol liver content in groupI(control rats) and groupII(portal hypertensive rats) at 1 mo of postoperative evolution and in group III (control rats) and group IV (portal hypertensive rats) at 1 year of postoperative evolution.
aP < 0.05, bP < 0.01 vs group III; dP < 0.01 vs groupI.
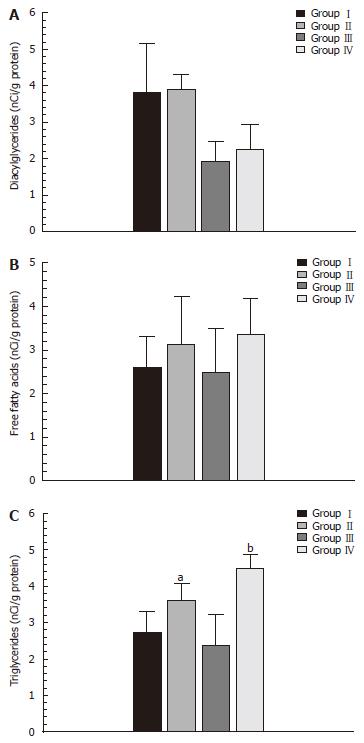
Figure 2 Liver synthesis of diacylglycerides, free fatty acids and triglycerides in groupI(control rats) and groupII(portal hypertensive rats) at 1 mo of postoperative evolution and in group III(control rats) and group IV (portal hypertensive rats) at 1 year of postoperative evolution.
aP < 0.05 vs groupI; bP < 0.01 vs group III.
- Citation: Aller MA, Vara E, García C, Nava MP, Angulo A, Sánchez-Patán F, Calderón A, Vergara P, Arias J. Hepatic lipid metabolism changes in short- and long-term prehepatic portal hypertensive rats. World J Gastroenterol 2006; 12(42): 6828-6834
- URL: https://www.wjgnet.com/1007-9327/full/v12/i42/6828.htm
- DOI: https://dx.doi.org/10.3748/wjg.v12.i42.6828


