Copyright
©2006 Baishideng Publishing Group Co.
World J Gastroenterol. Nov 7, 2006; 12(41): 6658-6664
Published online Nov 7, 2006. doi: 10.3748/wjg.v12.i41.6658
Published online Nov 7, 2006. doi: 10.3748/wjg.v12.i41.6658
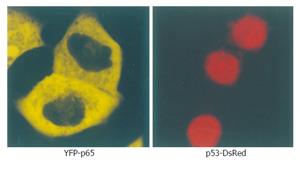
Figure 1 Microscopy of YFP-p65 and p53-DsRed in living cells.
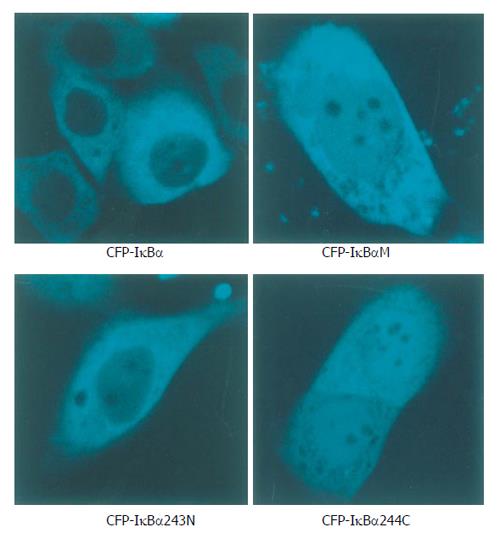
Figure 2 Localization patterns of CFP-IκBα, CFP-IκBαM, CFP-IκBα243N and CFP-IκBα244C in living cells.
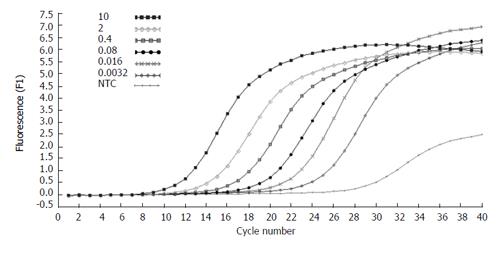
Figure 3 Amplification plots of five fold serial dilutions of β-actin cDNA.
The fluorescence values versus cycle number are displayed.
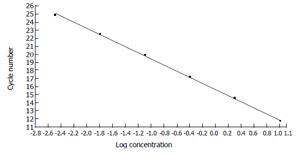
Figure 4 Standard curve constructed with the β-actin cDNA standards from 1.
00E + 1 to 3.20E + 3 by plotting the logarithmic concentration of the standard versus the crossing points (cycle number).
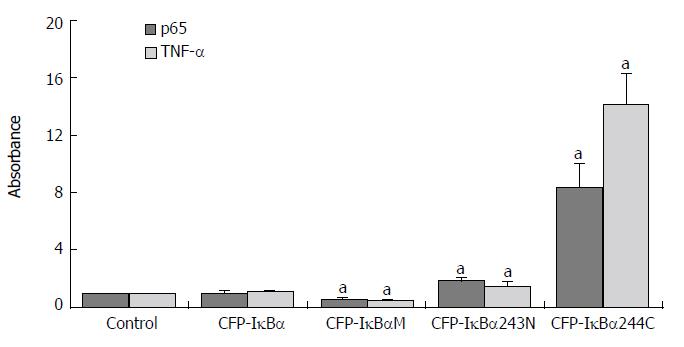
Figure 5 Effects of IκBα and its mutants on NF-κB and NF-κB downstream gene TNF-α.
Abscissa showed different transfected Cells. Y-coordinate expressed the target/reference ratio of the samples divided by the tar = get/reference ratio of the control. In all experiments β-actin cDNA was reference. (aP < 0.05 vs control).
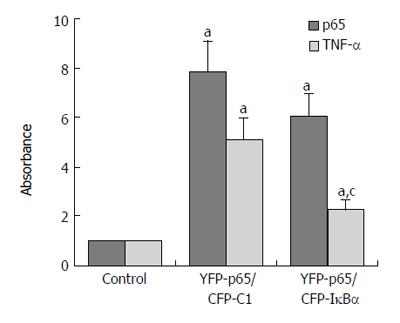
Figure 6 Effects of IκBα on over expressed NF-κB.
(aP < 0.05 vs control; cP < 0.05 vs YFP-p65/CFP-C1 group).
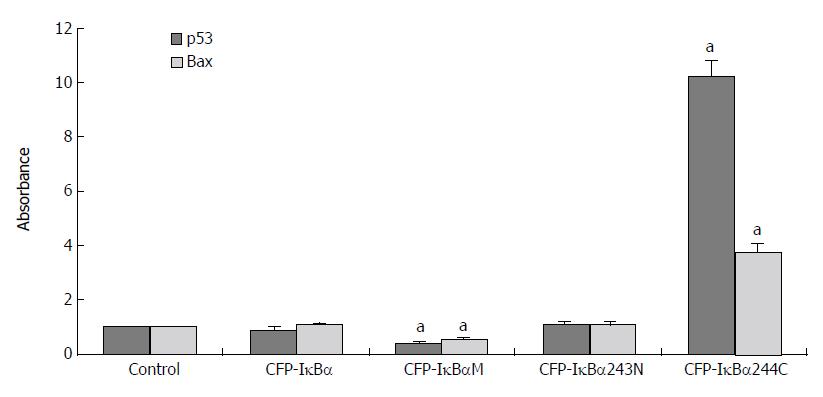
Figure 7 Effects of IκBα and its mutants on p53 and p53 downstream gene Bax.
(aP < 0.05 vs control).
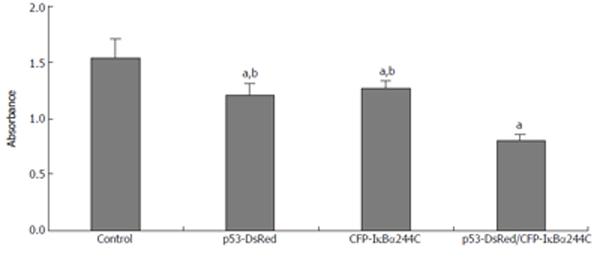
Figure 8 IκBα244C and p53 synergistically mediates apoptosis.
(aP < 0.05 vs control; bP < 0.01 vs p53-DsRed/CFP-IκBα244C group).
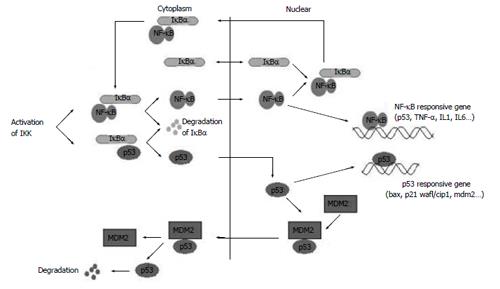
Figure 9 IκBα participates in NF-κB and p53 signaling pathways.
- Citation: Li X, Xing D, Wang J, Zhu DB, Zhang L, Chen XJ, Sun FY, Hong A. Effects of IκBα and its mutants on NF-κB and p53 signaling pathways. World J Gastroenterol 2006; 12(41): 6658-6664
- URL: https://www.wjgnet.com/1007-9327/full/v12/i41/6658.htm
- DOI: https://dx.doi.org/10.3748/wjg.v12.i41.6658


