Copyright
©2006 Baishideng Publishing Group Co.
World J Gastroenterol. Oct 28, 2006; 12(40): 6500-6506
Published online Oct 28, 2006. doi: 10.3748/wjg.v12.i40.6500
Published online Oct 28, 2006. doi: 10.3748/wjg.v12.i40.6500
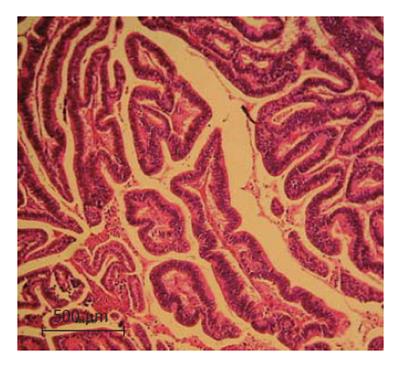
Figure 1 Hematoxylin and Eosin staining of the liver specimen (10 × magnification).
The histopathological analysis of the specimen indicates a well-differentiated peripheral cholangio-carcinoma with no vascular invasion.
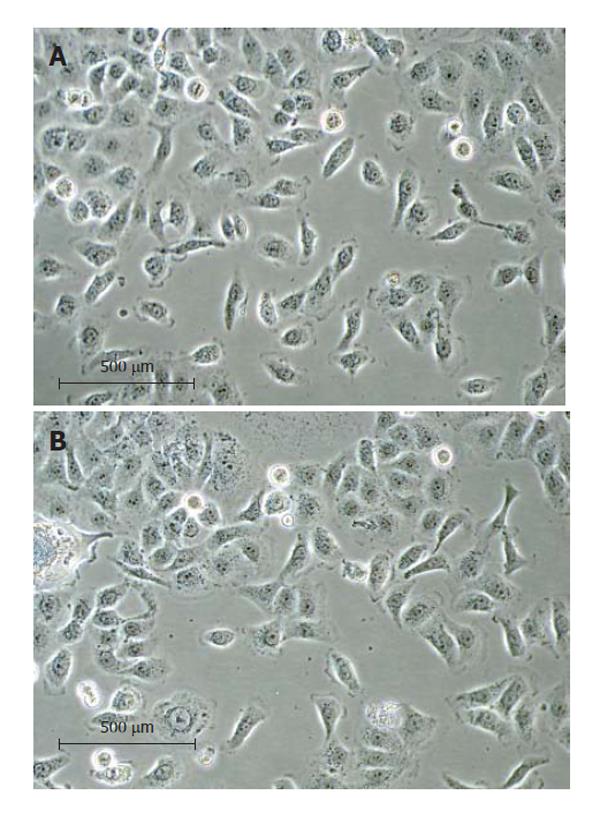
Figure 2 The RMCCA-1 culture under a phase contrast microscope at 20 × magnification.
(A) at 16th passage; (B) at 30th passage. The RMCCA-1 cells exhibited circular to spindle shape with many processes and ornamental fringes. The nucleus and cytoplasm appeared granulated.
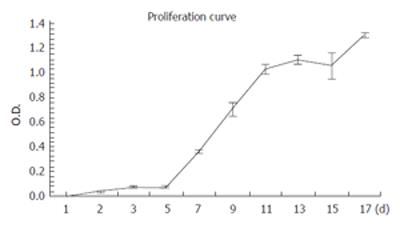
Figure 3 Growth kinetics of the RMCCA-1 cell line in vitro as analyzed by MTT assay.
The tumor doubling time during the exponential phase of growth was 48 h. Each point represents mean ± SE from 3 independent experiments, each performed in triplicates.
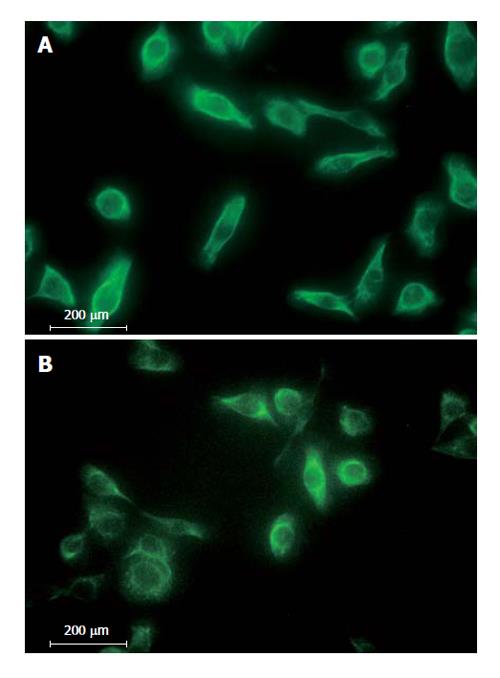
Figure 4 Immunofluoresence staining of RMCCA-1 cells with antibodies against (A) Cytokeratin 7; (B) AE-1/AE-3 at 40 × magnification.
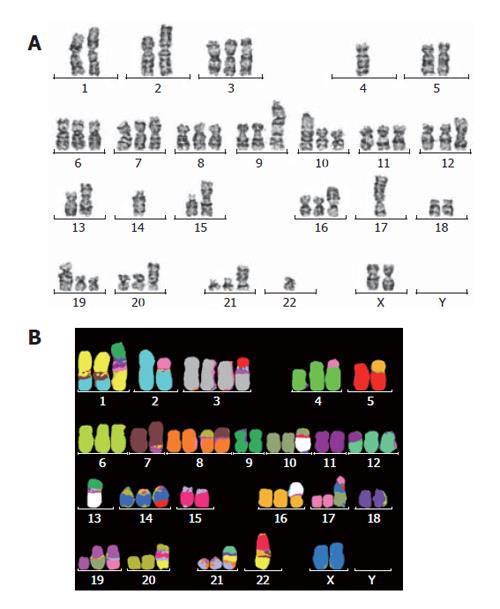
Figure 5 Representative karyotypes of RMCCA-1 cell line as assessed by (A) G-banding; (B) mFISH technique.
The karyotype showed 54-61(3n)XX, -Y, der(1), t(1;2;7)(q31;q31;q22), t(2;17)(q33;q12), der(3)t(3;15)(q21;q?), t(4;17)(p14;q?), der(7)t(7;15)(p22;q?), der(8)t(8;7)(p12;?), der(10)t(10;13)(q21;q11), der(12)t(11;12)(q?,p11.2), der(13)t(13;9)(q11;q11), der(14)t(15;14)(q34;q32), der(16)t(13;16)(q11;p13.3), der(17)t(X;10;17)(p?,p?,p11.2), der(19)t(10;19)(q11.2;p13.3), der(19)t(17;19)(q?;q?), der(21)t(1;9;21)(?;?;q11), der(22)t(1;15;22)(?,?,?).
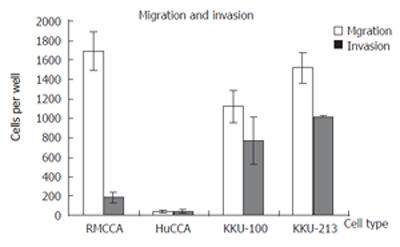
Figure 6 Invasion and migration rates of RMCCA-1 compared with KKU-213, KKU-100 and HuCCA-1 cell lines as determined by in vitro invasion and motility assay.
Approximately 1 × 10⁵ cells were seeded into the upper chamber of a transwell, and incubated for 6 h before the filter was fixed, stained, and the invading/migrating cells were counted under microscope.
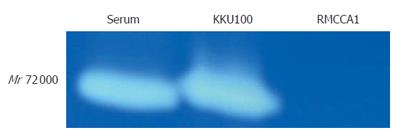
Figure 7 MMPs activity as determined by gelatin zymography.
An intense band at Mr 72 000 was shown in the FBS (fetal bovine serum) and the conditioned medium of KKU-100, but not of the RMCCA-1 cells. The Mr 72 000 band in KKU-100 has previously been shown to correspond to MMP-2 activity in many cell lines[11,12].
- Citation: Rattanasinganchan P, Leelawat K, Treepongkaruna SA, Tocharoentanaphol C, Subwongcharoen S, Suthiphongchai T, Tohtong R. Establishment and characterization of a cholangiocarcinoma cell line (RMCCA-1) from a Thai patient. World J Gastroenterol 2006; 12(40): 6500-6506
- URL: https://www.wjgnet.com/1007-9327/full/v12/i40/6500.htm
- DOI: https://dx.doi.org/10.3748/wjg.v12.i40.6500


