Copyright
©2006 Baishideng Publishing Group Co.
World J Gastroenterol. Oct 28, 2006; 12(40): 6473-6499
Published online Oct 28, 2006. doi: 10.3748/wjg.v12.i40.6473
Published online Oct 28, 2006. doi: 10.3748/wjg.v12.i40.6473
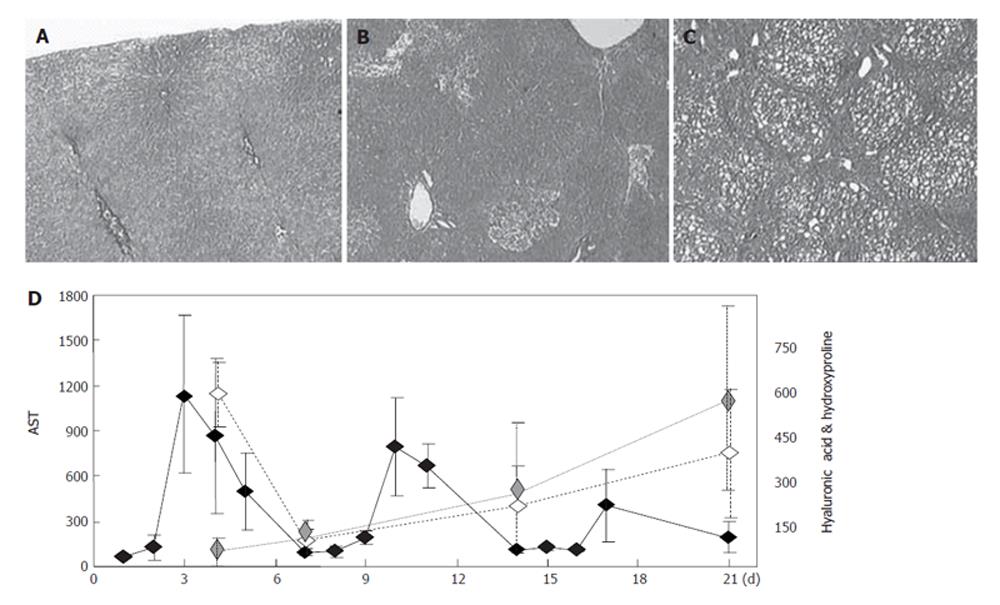
Figure 1 Histological and biochemical analyses of fibrogenesis.
A-C: Histological staining (HE staining) of control liver sections (A) and sections obtained on d 4 (B) and d 21 (C), respectively, after DMN administration; D: Biochemical analysis of fibrogenesis showing plasma AST levels (IU/L, solid line), plasma hyaluronic acid levels (ng/mL, dashed line), and liver hydroxyproline levels (ng/mL, dotted line). The x-axis shows the days of fibrogenesis, and each value on the graph is shown as the mean ± SE, n = 5.
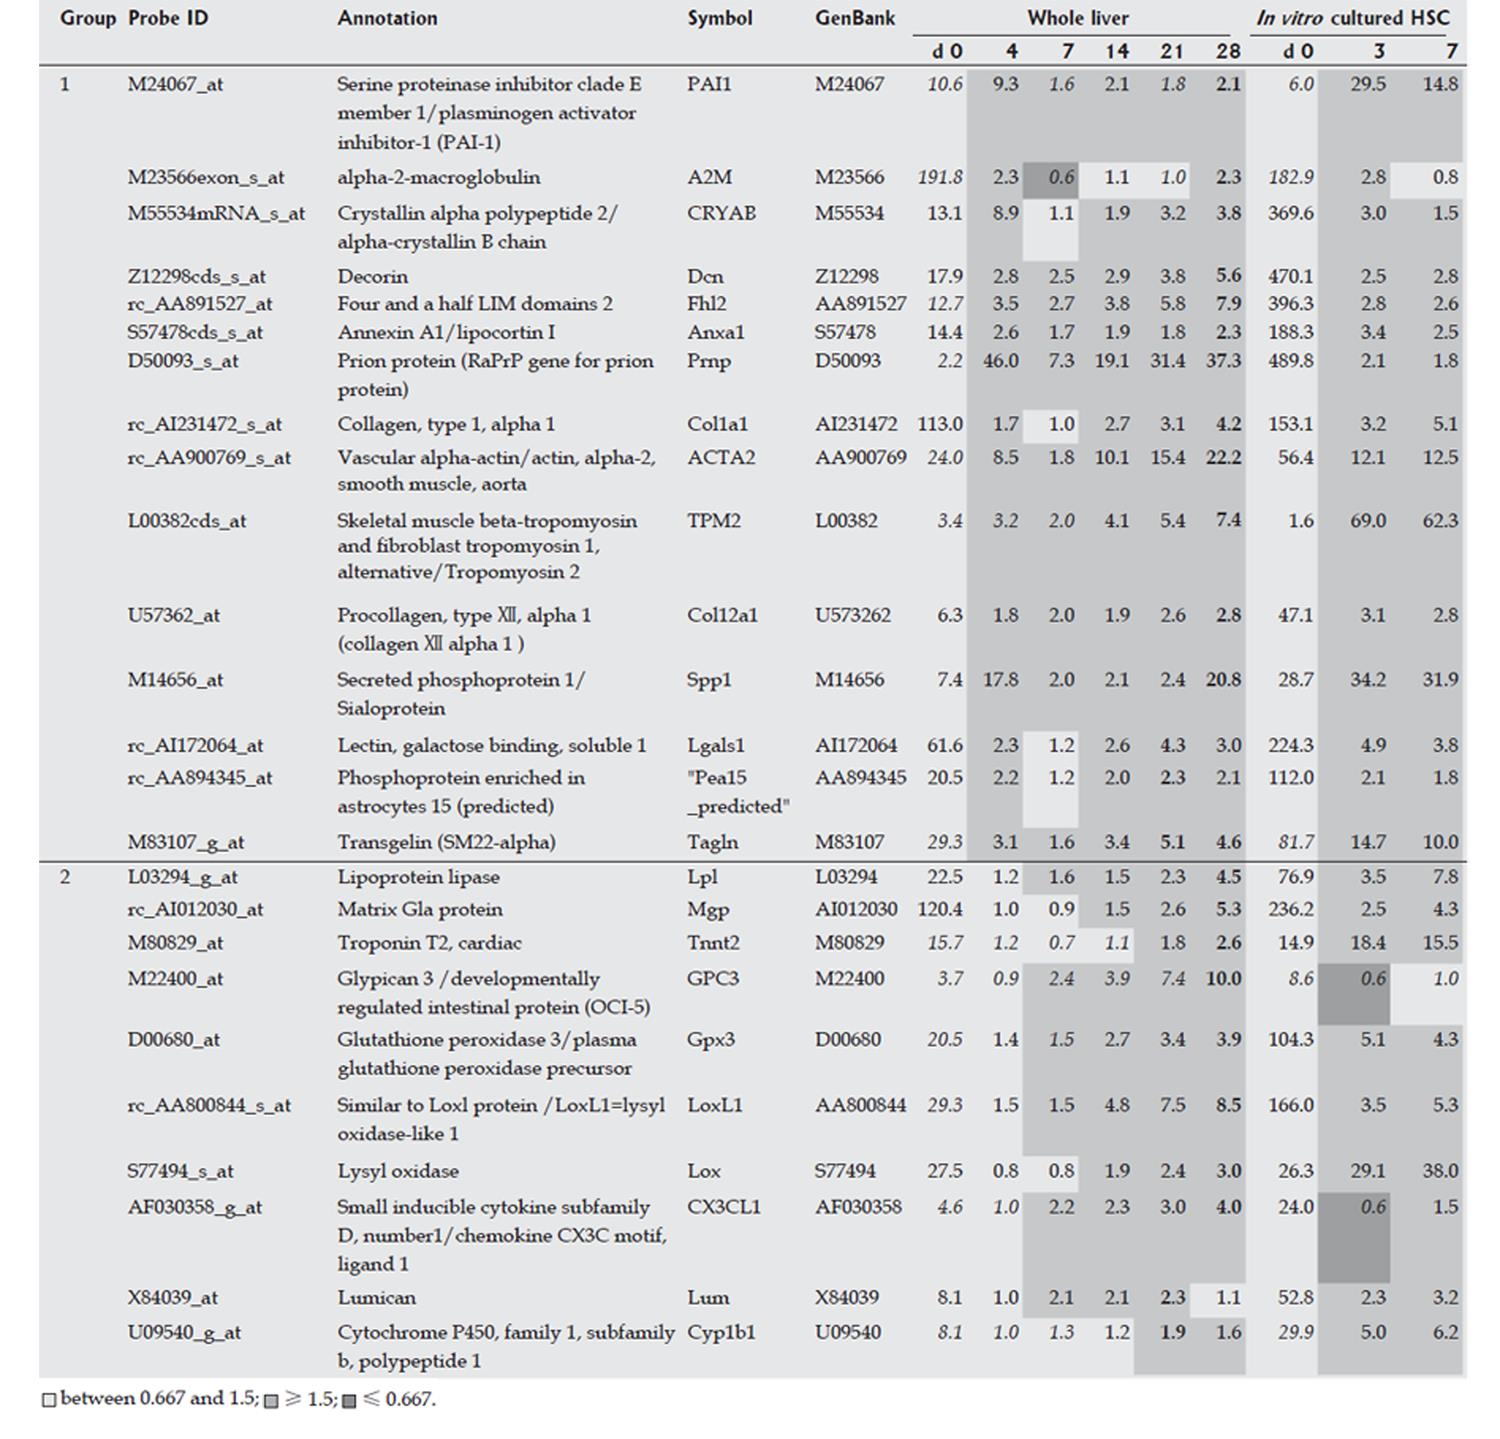
Figure 2 Marker genes for hepatic stellate cells (HSCs).
Expression profiles of the whole liver and in vitro cultured isolated HSCs were obtained using a rat genome U34A array (Affymetrix). Gene markers for HSCs are listed. For analysis of HSCs in the whole liver, expression intensities are given for d 0, and expression intensity data for d 4, 7, 14, 21 and 28 are shown as ratios to the d 0 expression data. The classification of group1 (2) corresponds to the presence (absence) of up-regulated peak in the acute inflammation phase. For analysis of in vitro cultured HSCs, expression levels for d 0 are also shown, and data for d 4 and 7 are similarly shown as ratios to the expression level on d 0. Italicized values indicate an “absent” call by the Affymetrix software. Bold text indicates the highest ratio in the chronic phase (d 7, 14, 21 and 28).
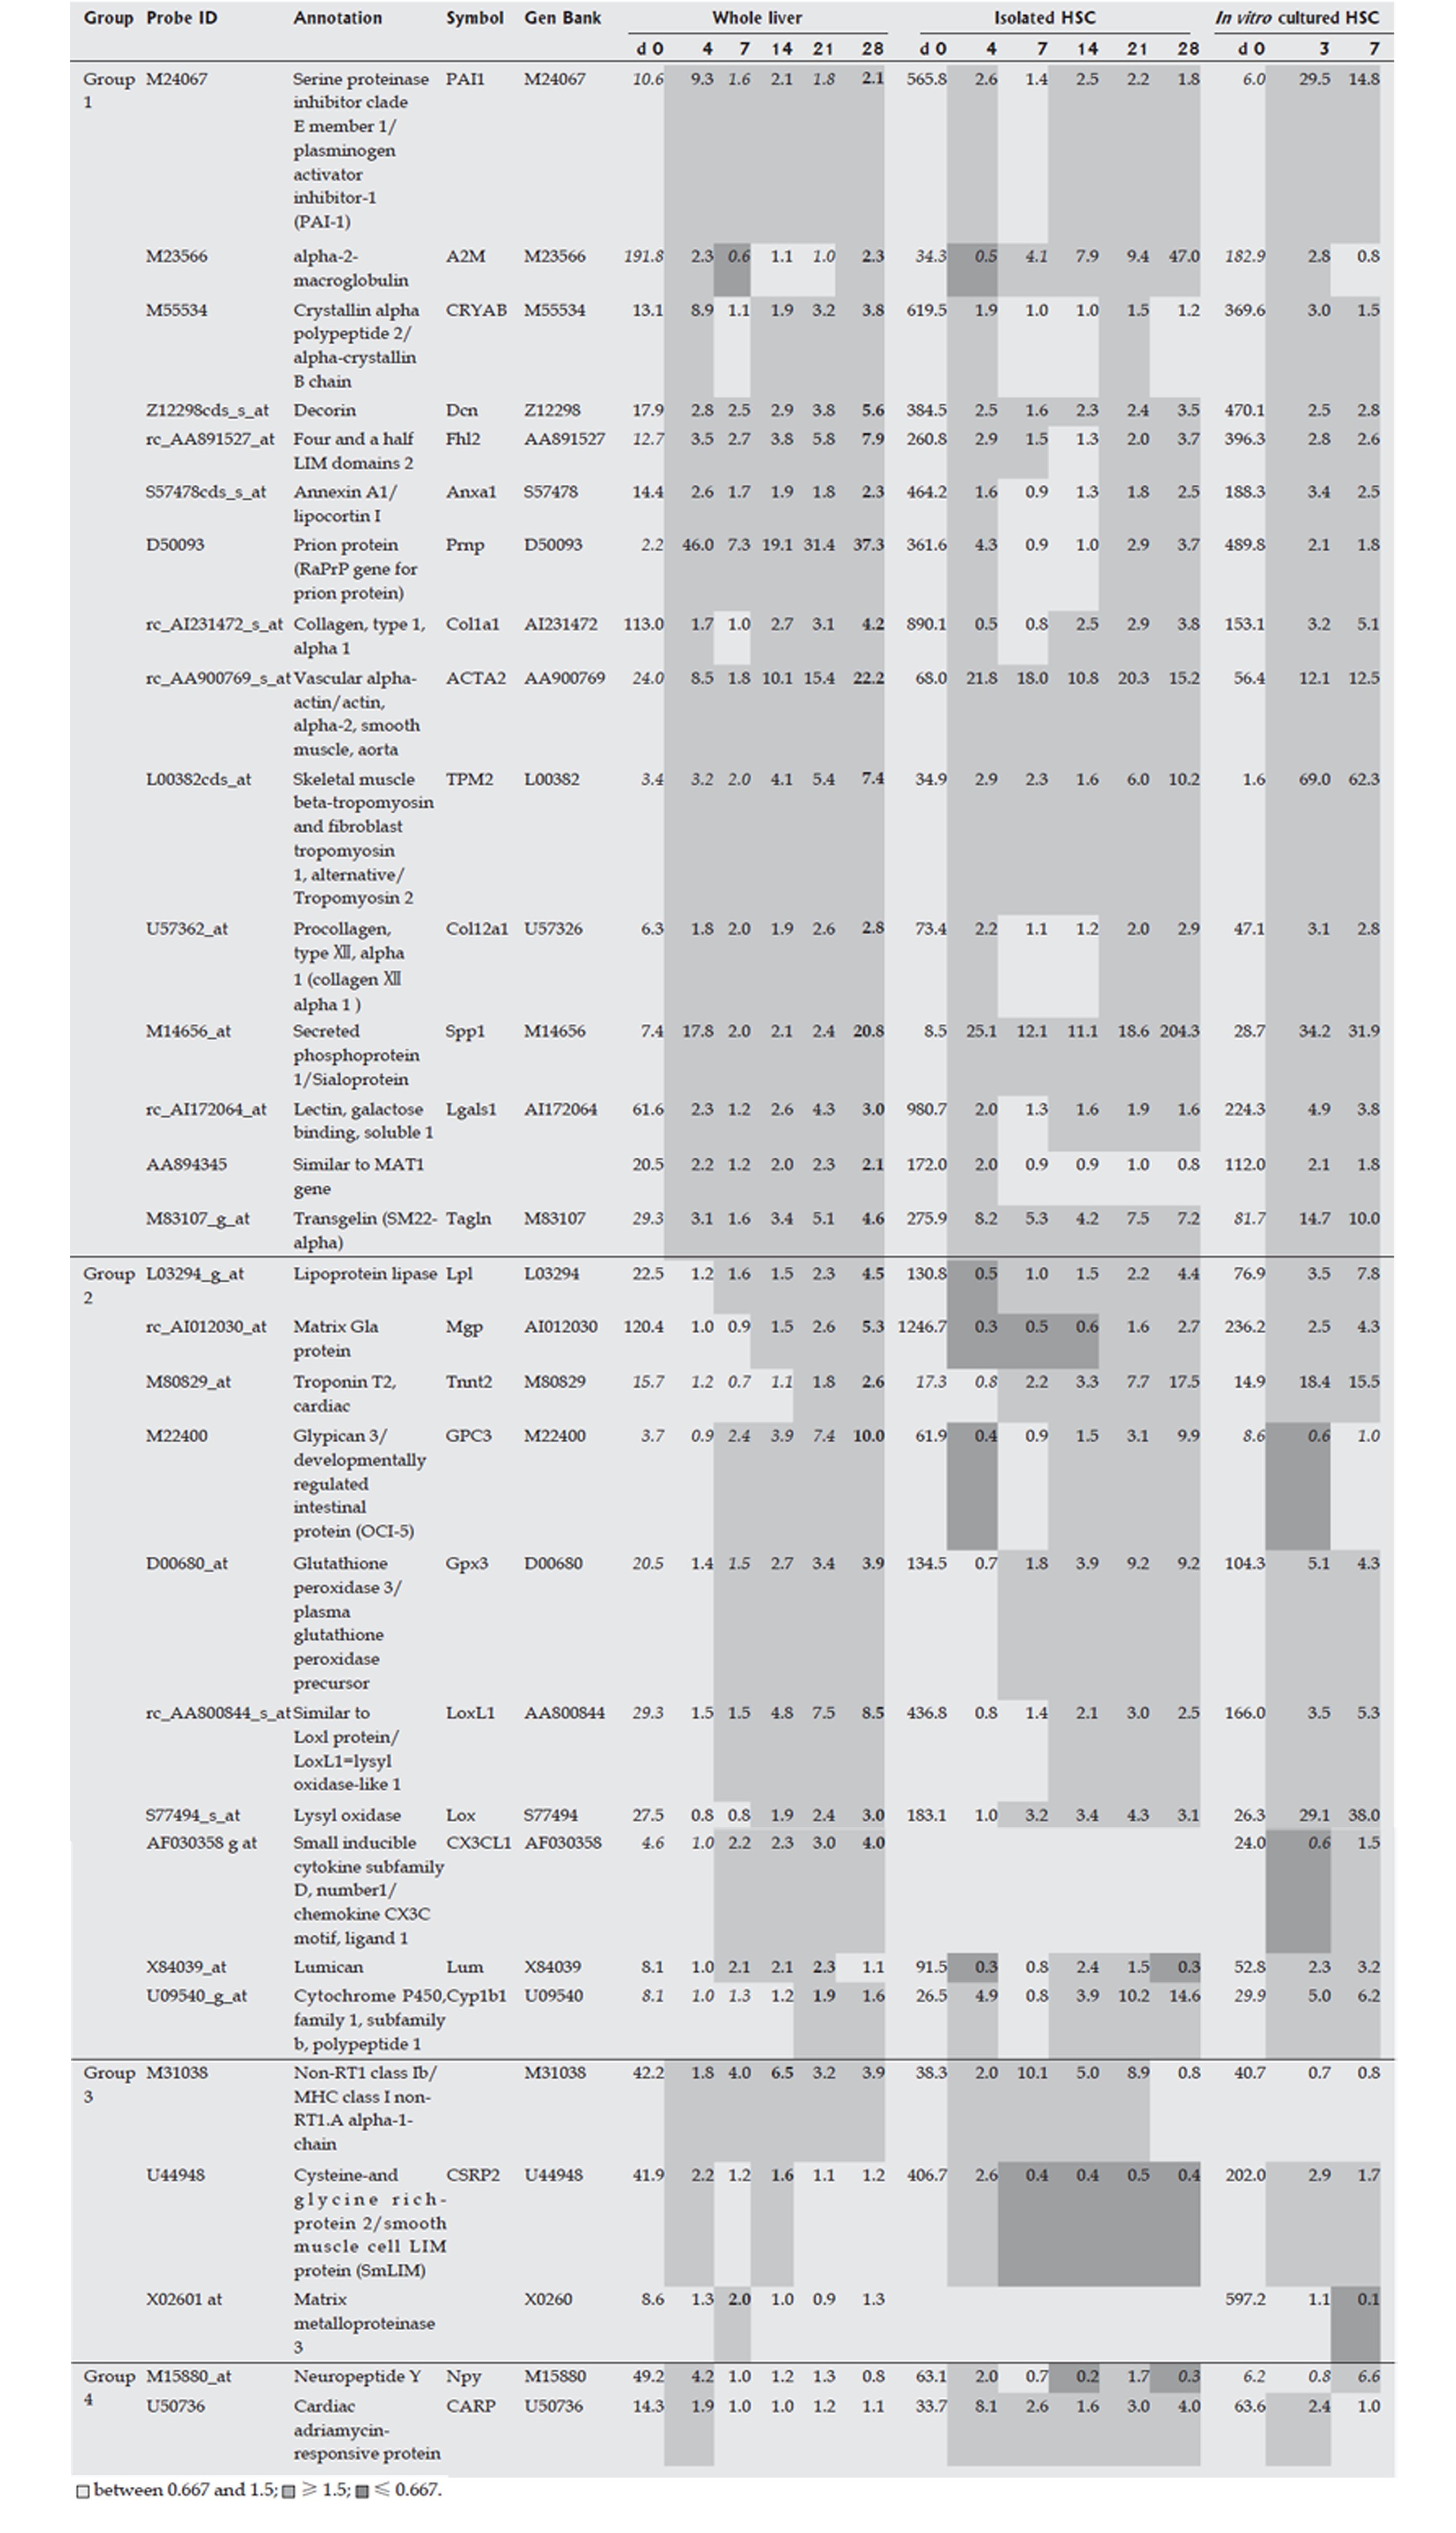
Figure 3 Marker genes in hepatic stellate cells (HSC).
Expression profiles of the whole liver, of isolated HSCs during fibrogenesis, and of in vitro cultured isolated HSCs were obtained using a rat Genome U34A Array (Affymetrix). Marker genes for HSCs are listed. Expression intensities are shown for d 0, and expression intensity data for d 4, 7, 14, 21 and 28 are displayed as ratios to the d 0 expression levels for the analysis of whole liver and isolated HSCs. For in vitro cultured HSCs, the d 0 data are similarly shown as expression intensities, and data on d 4 and 7 are shown as ratios to the expression levels on d 0. Italics indicate an “absent” call by the Affymetrix software, and bold text indicates the highest ratio in the chronic phase (d 7, 14, 21 and 28).
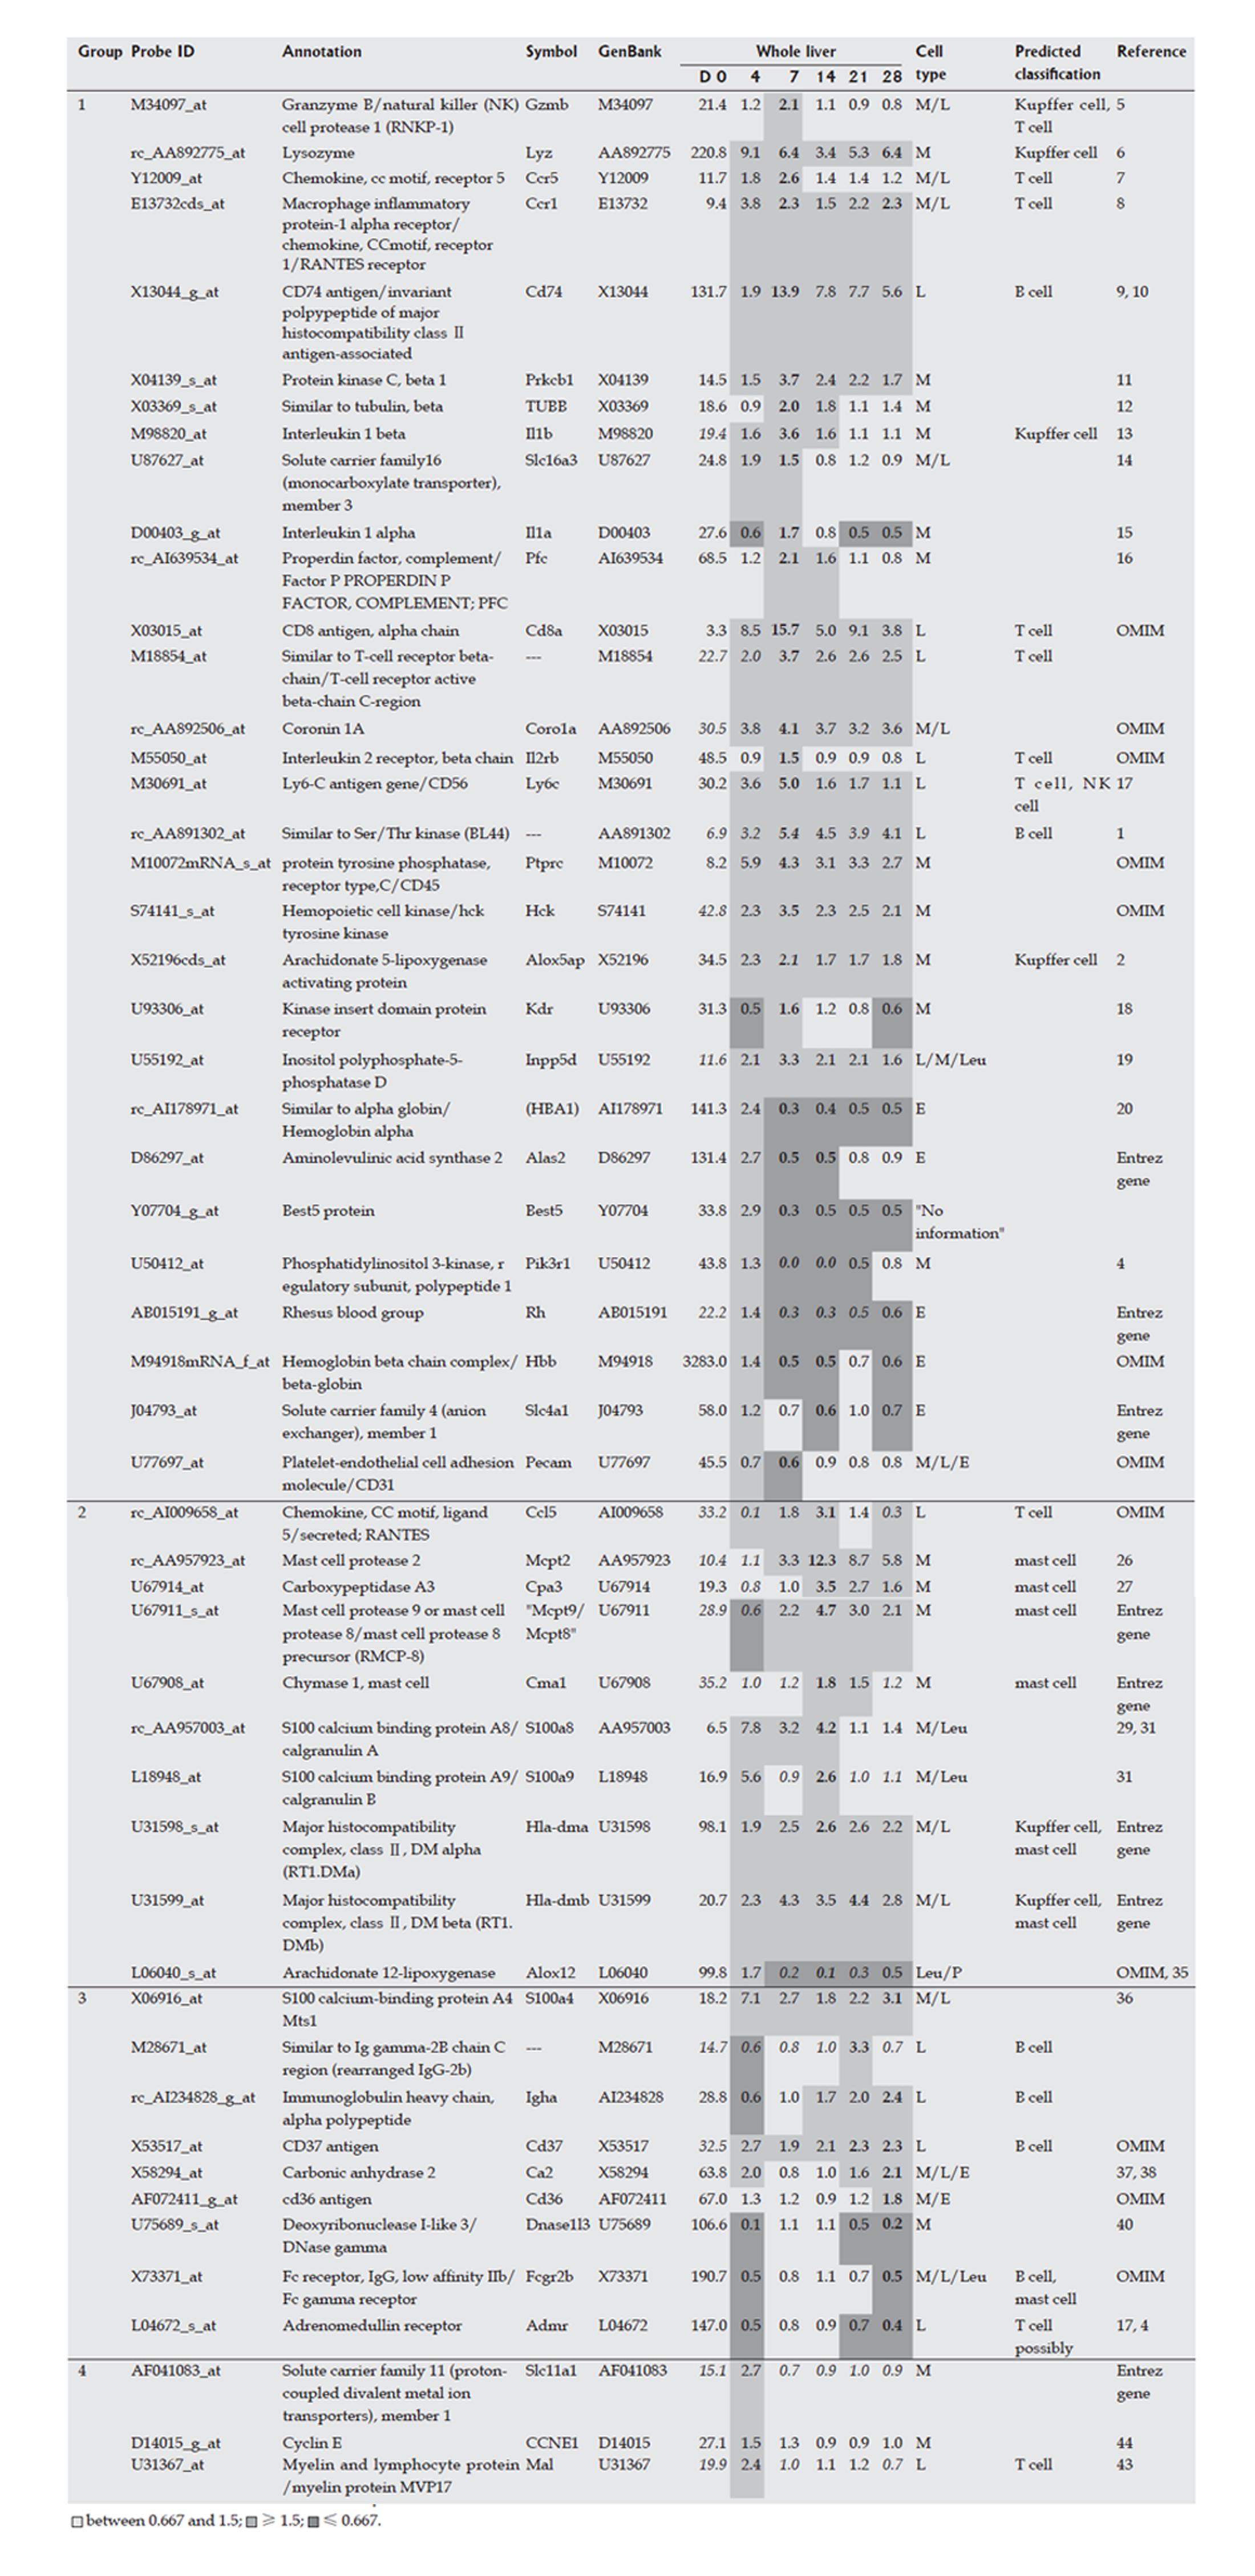
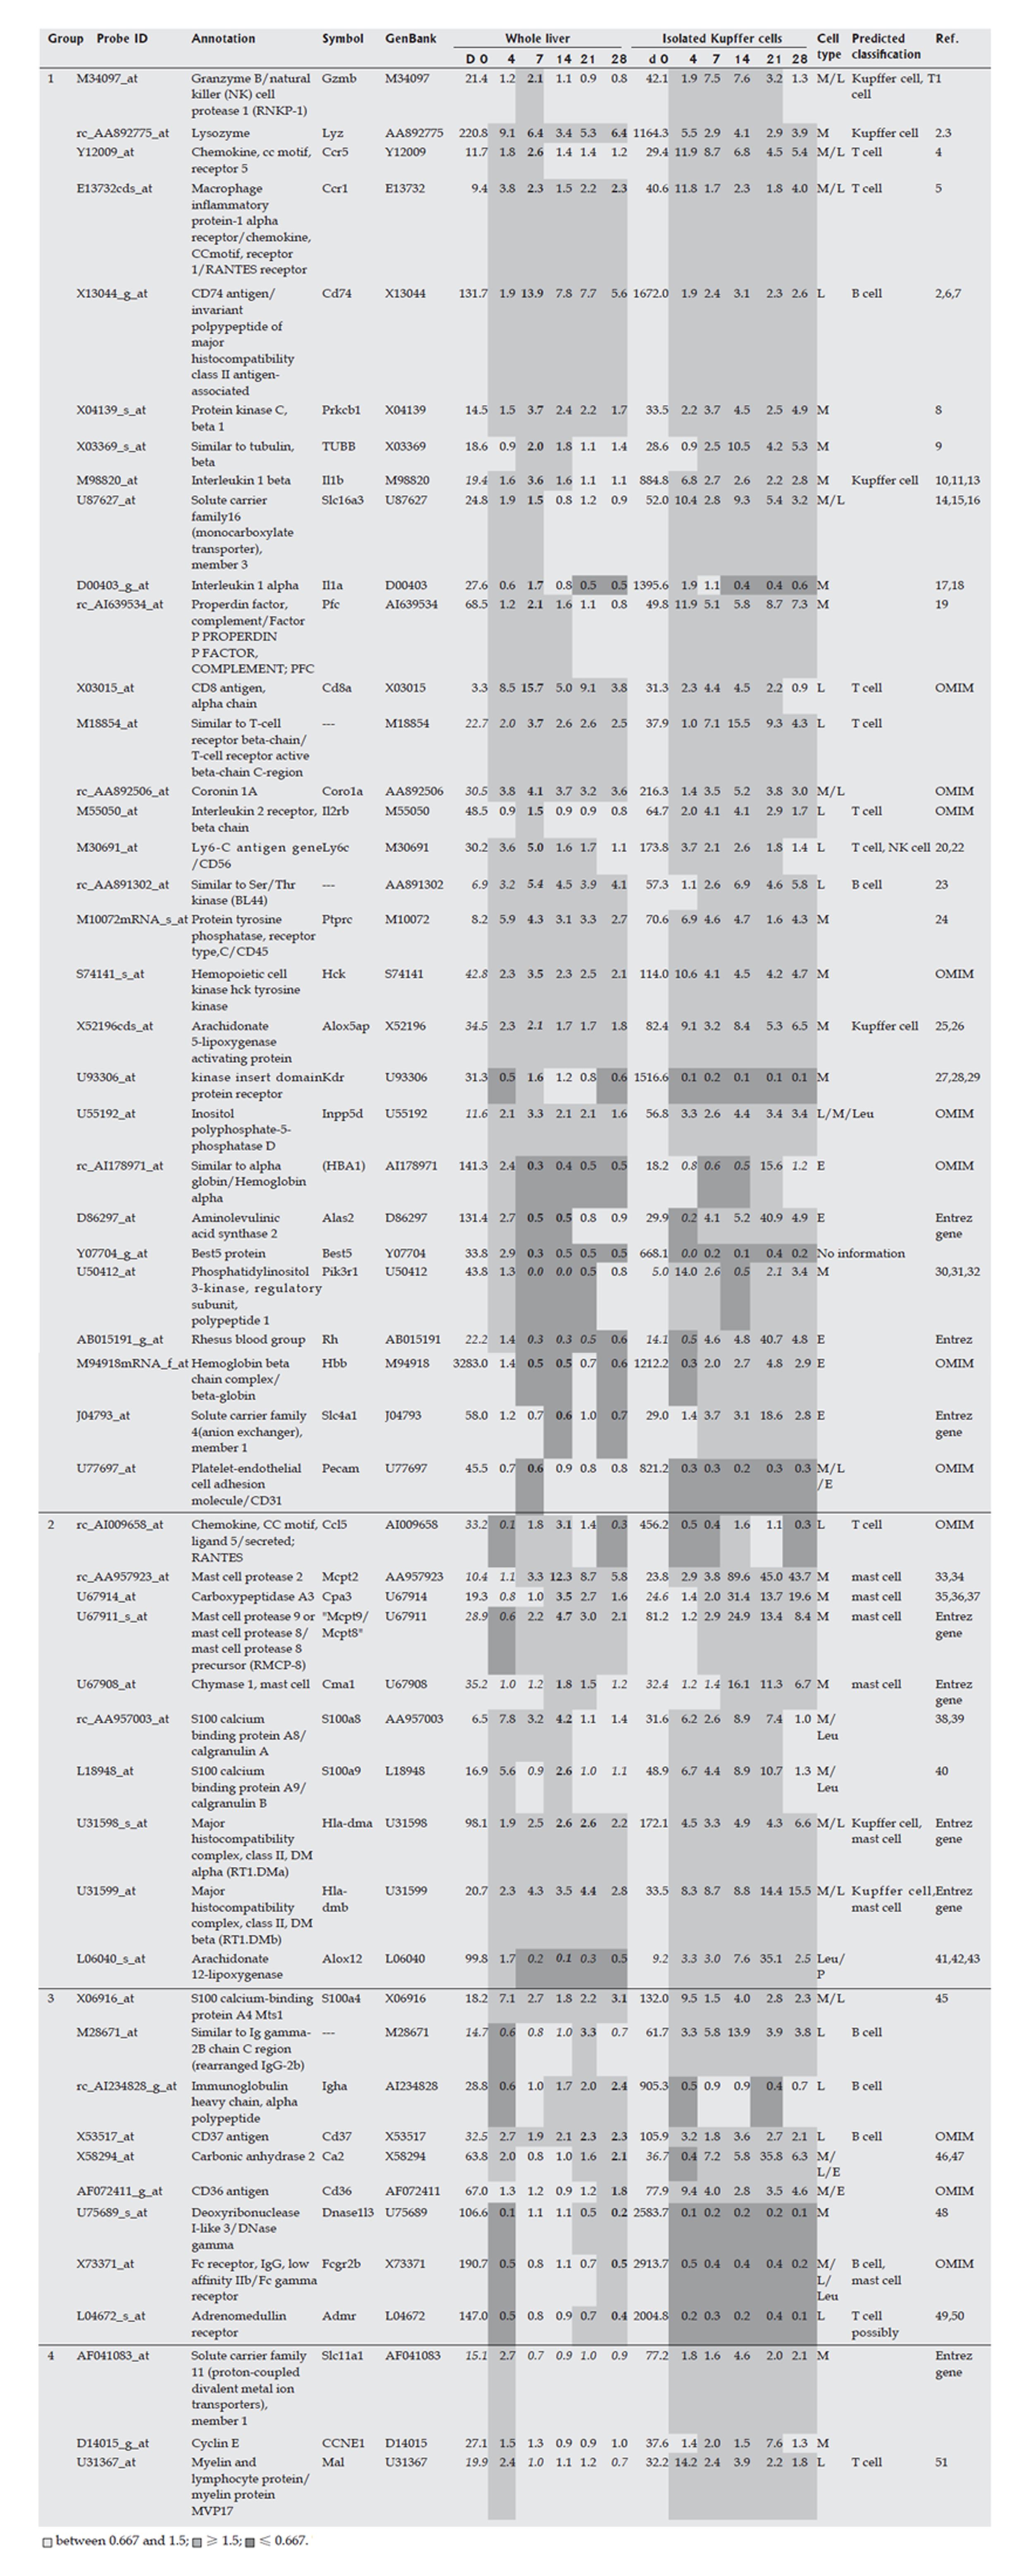
Figure 4 Marker genes for hematopoietic cells in the Kupffer cell fraction.
Expression profi les of the whole liver and the isolated Kupffer cell fraction during fi brogenesis were obtained using a rat genome U34A array (Affymetrix). Marker genes for hematopoietic cells in the Kupffer cell fraction are listed. Expression intensities are given for d 0, and expression intensity data for d 4, 7,14, 21 and 28 are shown as ratios to the d 0 expression data for analysis of hematopoietic cells in whole liver. The classifi cation of genes into groups 1-4 and corresponds to the maximum change of expression at the different time points on d 7, 14, 21, 28 and 4, respectively. Italicized values indicate an “absent” call by the Affymetrix software. The bold values indicate the highest or lowest ratio in the chronic phase (d 7, 14, 21 and 28). Cell types in the infl ammatory cell fraction are as follows: M: Monocytes and their progenitors; L: Lymphocytes and their progenitors; E: Erythrocytes and their progenitors; P: Platelets and their progenitors; Leu: Other kinds of leukocytes and their progenitors.
Figure 5 Marker genes in hematopoietic cells in the Kupffer cell fraction.
Expression profiles of the whole liver and the isolated Kupffer cell fraction during fibrogenesis were obtained using a rat Genome U34A Array (Affymetrix). Marker genes of hematopoietic cells in the Kupffer cell fraction are listed. Expression intensities are shown for d 0, and the expression intensity data for d 4, 7, 14, 21 and 28 are displayed as ratios to the d 0 expression levels. Italics indicate an “absent” call by the Affymetrix software. Bold values indicate the highest or lowest ratio in the chronic phase (d 7, 14, 21 and 28). The cell types in the infl ammatory cell fraction are as follows: M: Monocytes and their progenitors; L: Lymphocytes and their progenitors; E: Erythrocytes and their progenitors; P: Platelets and their progenitors; Leu: Other kinds of leukocytes and their progenitors.
Figure 6 Marker genes for hepatocytes.
Expression profiles of whole liver or isolated hepatocytes during fibrogenesis were obtained using a rat Genome U34A Array (Affymetrix). Marker genes for hepatocytes, which are the main contributors to the expression profile of the whole liver, are listed. Expression intensities are given for d 0, and expression intensity data for d 4, 7, 14, 21 and 28 are displayed as ratios to the d 0 expression data. Italics indicate an “absent” call by the Affymetrix software. Genes with the highest or lowest ratio in the chronic phase are shown in bold text.
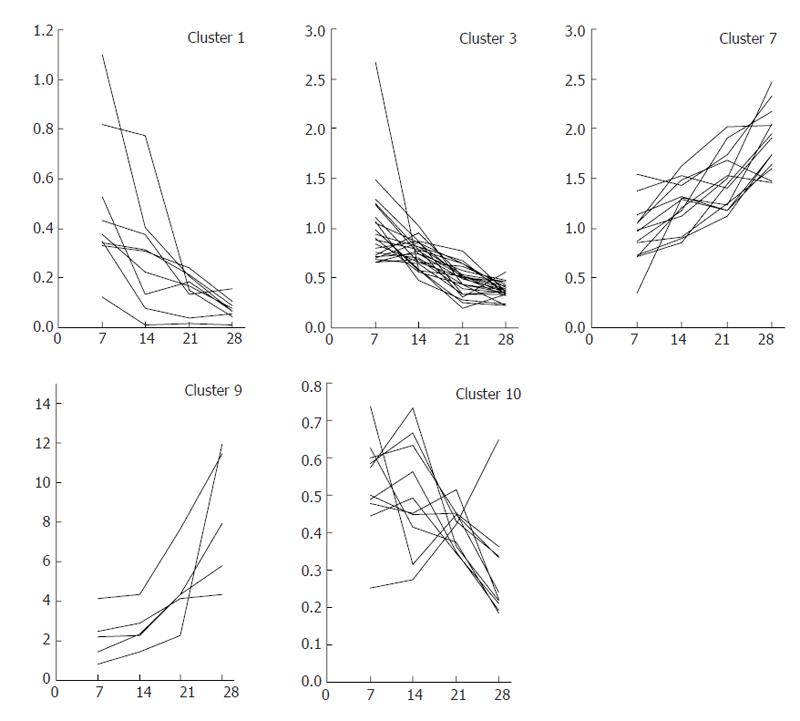
Figure 7 Cluster of genes that increased or decreased in expression with progression of fibrogenesis.
Gene expression profiles in the chronic phase (d 7, 14, 21 and 28) were clustered into 10 patterns using K-means analysis. Clustered genes with a tendency to temporally decrease (clusters 1, 3 and 10) or increase (clusters 7 and 9) were selected as gene markers that had a strong relationship with fibrogenesis.
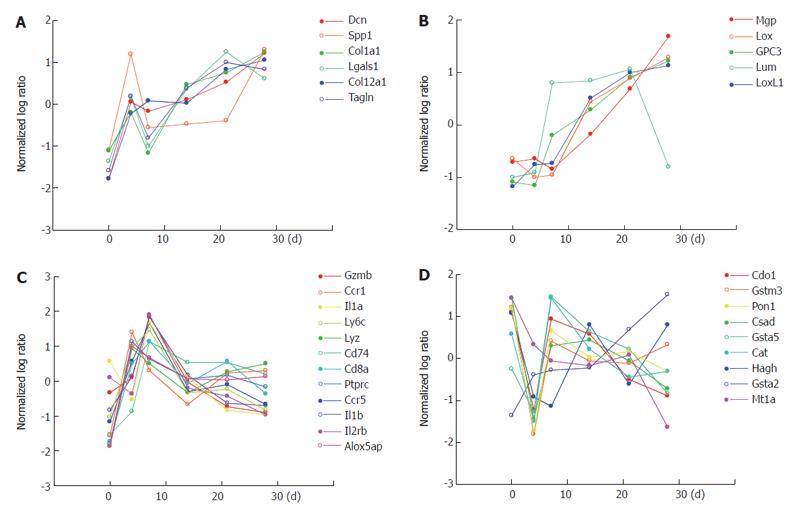
Figure 8 Differential regulations of genes involved in key events of liver fibrosis.
Gene expression profiles of different events in liver fibrogenesis such as ECM synthesis/degradation, inflammation and oxidative stress, are shown. The x-axis showing the days of fibrogenesis (d 0, 4, 7 14, 21, 28) and the y-axis the normalized log ratio(scaled in terms of mean and SD, and the log base 2) of the whole liver gene expression. A and B: genes of ECM synthesis/degradation classified into group 1 (2) of HSCs as shown in Figure 2; C: genes of inflammation involved in the Kupffer cell fraction as shown in Figure 4; D: genes of oxidative stress involved in the hepatocytes as shown in Figure 6.
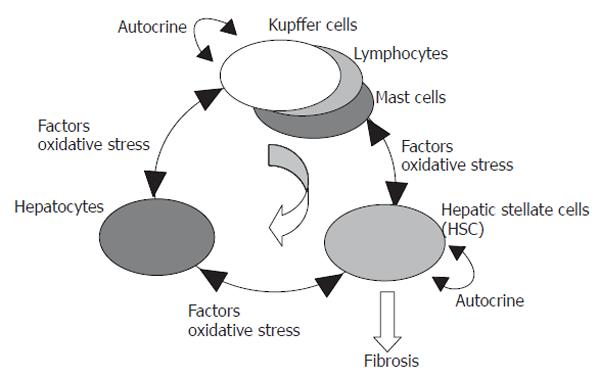
Figure 9 Circuit model of hepatic cells in fibrogenesis.
Gene expression profiles show that HSCs have self-activating properties, and that widespread damage to hepatocytes occurred in development of fibrosis, suggesting a self-activating circuit model of fibrogenesis. After an initial stimulatory trigger caused by events such as virus infection, hepatic cells are able to stimulate each other, and the self-activating properties of HSCs maintain this cycle over the long term. Details are given in the text.
- Citation: Takahara Y, Takahashi M, Wagatsuma H, Yokoya F, Zhang QW, Yamaguchi M, Aburatani H, Kawada N. Gene expression profiles of hepatic cell-type specific marker genes in progression of liver fibrosis. World J Gastroenterol 2006; 12(40): 6473-6499
- URL: https://www.wjgnet.com/1007-9327/full/v12/i40/6473.htm
- DOI: https://dx.doi.org/10.3748/wjg.v12.i40.6473


