Copyright
©2006 Baishideng Publishing Group Co.
World J Gastroenterol. Oct 14, 2006; 12(38): 6133-6141
Published online Oct 14, 2006. doi: 10.3748/wjg.v12.i38.6133
Published online Oct 14, 2006. doi: 10.3748/wjg.v12.i38.6133
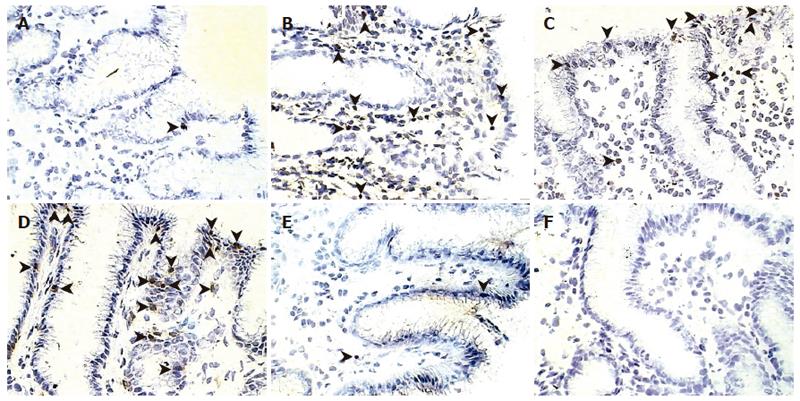
Figure 1 Terminal deoxynucleotidyltransferase (TdT)-mediated dUDP-biotin nick end labelling (TUNEL)-positive apoptotic cells.
Photomicrographs show tissues obtained from the antral mucosa of: a non-infected control patient (A), a patient with H pylori-associated gastritis (B), a patient with active gastric ulcer (C), at the ulcer margin of the same patient (D), and after eradication therapy (E), and a negative control, without TdT enzyme (F), respectively. Arrowheads show positive cells in the epithelium and in the lamina propria (Original magnification × 400).
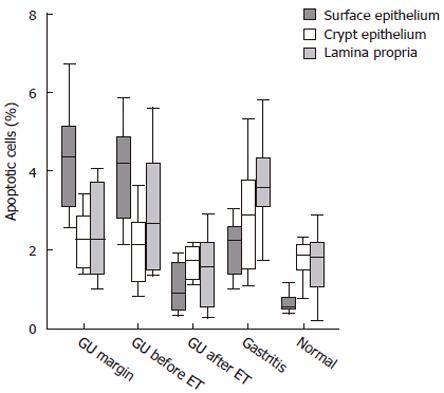
Figure 2 Percentages of apoptotic cells in the surface and crypt epithelium, and in the lamina propria of patients with gastric ulcer (GU) [at the ulcer margin, and the antrum before and after eradication therapy (ET)], H pylori-associated gastritis, and non-infected controls, respectively.
Horizontal bars represent medians, boxes represent the 25th and 75th percentiles, and vertical bars represent ranges. In the surface epithelium values were significantly different compared to GU after ET (P = 0.018; P = 0.003; P = 0.027); gastritis (P = 0.003; P = 0.002), and the control group (P < 0.001; P = 0.001). In the lamina propria values were significantly different compared to GU after ET (P = 0.001), and the control group (P = 0.001). In the crypt epithelium values were not significantly different among groups (n: GU = 12, H pylori-associated gastritis = 11, control = 10). Differences were analysed using one-way ANOVA with the Dunnett’s test for multiple comparisons. The Wilcoxon signed rank test was used for comparisons between GU patients.
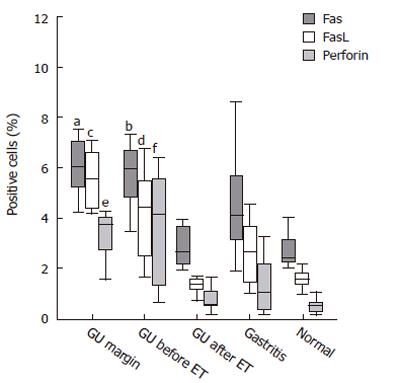
Figure 3 Quantitative analysis of apoptosis-related proteins in the gastric lamina propria of patients with gastric ulcer (GU) [at the ulcer margin, and the antrum before and after eradication therapy (ET)], H pylori-associated gastritis, and non-infected controls, respectively.
Horizontal bars represent medians, boxes represent the 25th and 75th percentiles, and vertical bars represent ranges. Values of Fas were significantly different compared with the antral mucosa after ET (aP = 0.005, bP = 0.008), and the normal group (aP < 0.001, bP = 0.031). Values of FasL were significantly different compared to GU after ET (cP = 0.003, dP = 0.008), gastritis (cP < 0.001), and the control group (cP < 0.001, dP = 0.018). Values of perforin were significantly different compared to GU after ET (eP = 0.005, fP = 0.008), gastritis (eP = 0.004, fP = 0.033), and the control group (eP = 0.001, fP = 0.006) (n: GU = 12, H pylori-associated gastritis = 11, control = 10). Differences were analysed using one-way ANOVA with the Dunnett’s test for multiple comparisons. The Wilcoxon signed rank test was used for comparisons between GU patients.
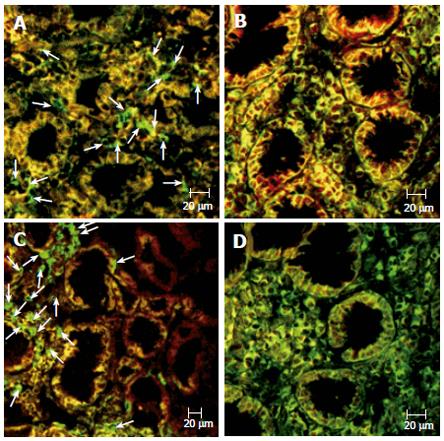
Figure 4 Double immunofluorescence analysis.
Expression of CD3 (FITC) and Fas (R-PE) in the ulcer margin of a patient with gastric ulcer (A) and a non-infected control (B). Expression of CD68 (FITC) and Fas (R-PE) in the antrum of a patient with gastric ulcer (C) and a patient with H pylori-related gastritis (D). Images obtained by confocal microscopy. Arrows show CD3 or CD68 (FITC)-single-positive cells (green) without correspondent Fas (R-PE)-positive cells in the lamina propria of the same tissue section.
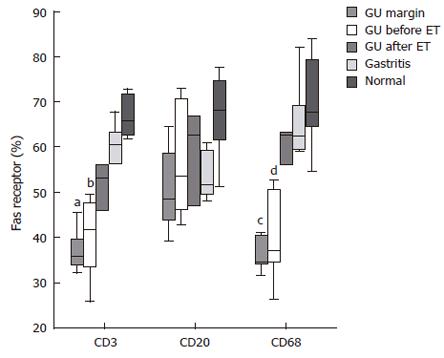
Figure 5 Percentages of the expression of Fas by CD3, CD20, and CD68 positive cells in the antral lamina propria of patients with gastric ulcer (GU) [at the ulcer margin, and at the antrum before and after eradication therapy (ET)], patients with H pylori-associated gastritis, and from non-infected controls, respectively.
Horizontal bars represent medians, boxes represent the 25th and 75th percentiles, vertical bars represent ranges. In regard of the expression of Fas with CD3 values were significantly different compared to GU after ET (a,bP = 0.043), gastritis (aP = 0.021); and the control group (aP < 0.001; bP = 0.012). For Fas expression with CD20 values were not significantly different among groups. For Fas expression with CD68 values were significantly different compared to GU after ET (c,dP = 0.043), gastritis (cP = 0.007; dP = 0.034); and the control group (cP = 0.012; dP = 0.027) (n = 6, in each group). Differences were analysed using one-way ANOVA with the Dunnett’s test for multiple comparisons. The Wilcoxon signed rank test was used for comparisons between GU patients.
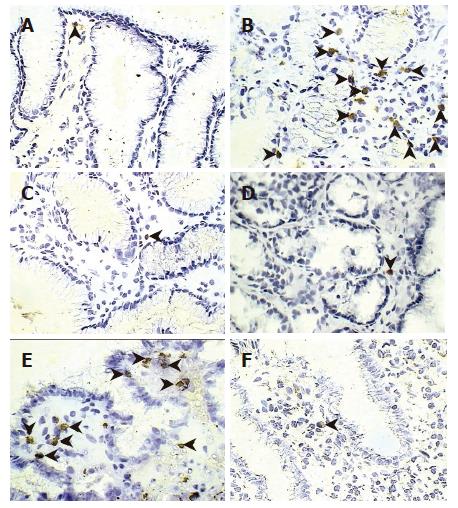
Figure 6 Apoptosis-related proteins in the gastric mucosa stained with immunoperoxidase.
Photomicrographs show the antral mucosa stained for FasL in a non-infected control patient (A), at the ulcer margin (B), and after eradication therapy of the same patient (C). Immunostaining for perforin is shown in a patient with H pylori-associated gastritis (D), and in a patient with gastric ulcer before (E), and after eradication therapy (F), respectively. Arrowheads show immunoreactive cells (Original magnification × 400).
-
Citation: Souza HS, Neves MS, Elia CC, Tortori CJ, Dines I, Martinusso CA, Madi K, Andrade L, Castelo-Branco MT. Distinct patterns of mucosal apoptosis in
H pylori -associated gastric ulcer are associated with altered FasL and perforin cytotoxic pathways. World J Gastroenterol 2006; 12(38): 6133-6141 - URL: https://www.wjgnet.com/1007-9327/full/v12/i38/6133.htm
- DOI: https://dx.doi.org/10.3748/wjg.v12.i38.6133


