Copyright
©2006 Baishideng Publishing Group Co.
World J Gastroenterol. Sep 28, 2006; 12(36): 5853-5858
Published online Sep 28, 2006. doi: 10.3748/wjg.v12.i36.5853
Published online Sep 28, 2006. doi: 10.3748/wjg.v12.i36.5853
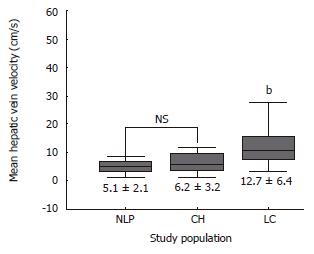
Figure 1 Mean hepatic vein velocity in study populations.
It was significantly higher in cirrhotic patients than non-cirrhotic controls. (mean ± SD; bP < 0.0001 vs NLP and CH).
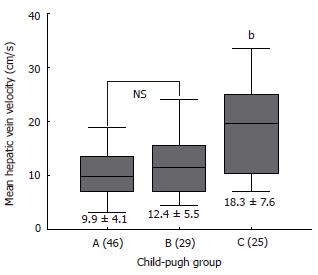
Figure 2 Mean hepatic vein velocity in study population.
Hepatic vein velocity in cirrhotic patients according to Child-Pugh group (mean ± SD; bP < 0.0001 vs A and B).
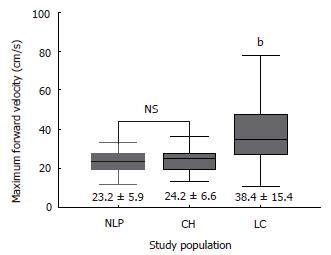
Figure 3 Maximum forward velocity of hepatic vein in study populations.
(mean ± SD; bP < 0.0001 vs NLP and CH).
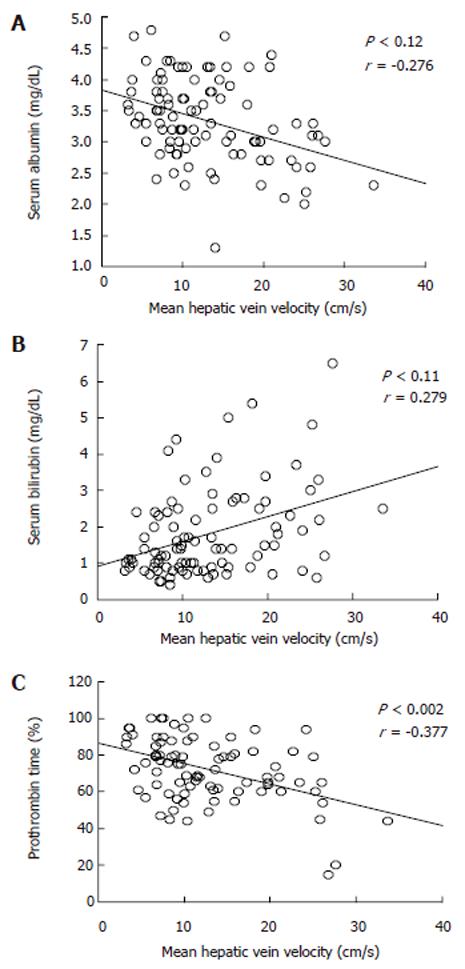
Figure 4 Relation between mean hepatic vein velocity and liver function test in cirrhotic patients.
A: serum albumin; B: serum bilirubin; C: prothrombin time.
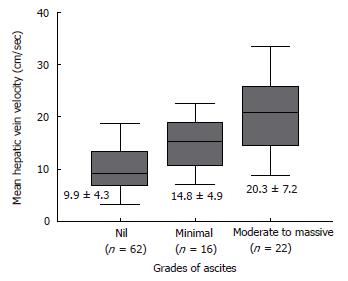
Figure 5 Mean hepatic vein velocity in patients depending upon the accumulation of ascites.
(mean ± SD; bP < 0.01 vs nil and moderate to massive).
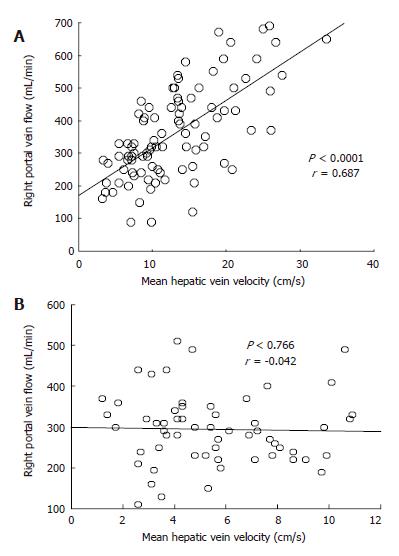
Figure 6 Correlation between mean hepatic vein velocity and right portal vein flow in cirrhotic patients (A) and controls (B).
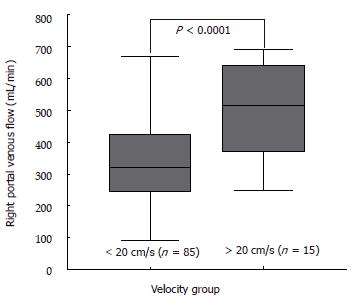
Figure 7 Right portal flow in cirrhotic patients.
“Very high” group, which we defined as those having velocity ≥ 20 cm/s had increased perfusion of right lobe of the liver.
- Citation: Sudhamshu K, Matsutani S, Maruyama H, Akiike T, Saisho H. Doppler study of hepatic vein in cirrhotic patients: Correlation with liver dysfunction and hepatic hemodynamics. World J Gastroenterol 2006; 12(36): 5853-5858
- URL: https://www.wjgnet.com/1007-9327/full/v12/i36/5853.htm
- DOI: https://dx.doi.org/10.3748/wjg.v12.i36.5853


