Copyright
©2006 Baishideng Publishing Group Co.
World J Gastroenterol. Sep 28, 2006; 12(36): 5834-5845
Published online Sep 28, 2006. doi: 10.3748/wjg.v12.i36.5834
Published online Sep 28, 2006. doi: 10.3748/wjg.v12.i36.5834
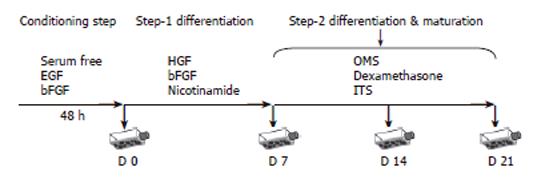
Figure 1 Hepatic differentiation protocol by sequential addition of exogenous factors according to embryogenesis.
Passage 2 cultures at 85% of confluency were used for differentiation assays. Cells were pre-cultured in serum-free medium supplemented with EGF and bFGF for 2 d (Conditioning step). Then cells were cultured in medium supplemented with HGF, bFGF and nicotinamide, for 7 d (Step-1 differentiation). Finally cells were cultured in maturation medium supplemented with OMS, dexamethasone, and ITS + premix (insulin, transferrin, selenious acid, BSA and linoleic acid) up to 21 d (Step-2 differentiation; maturation). Media were changed twice a week and hepatic differentiation was assessed at different time points.
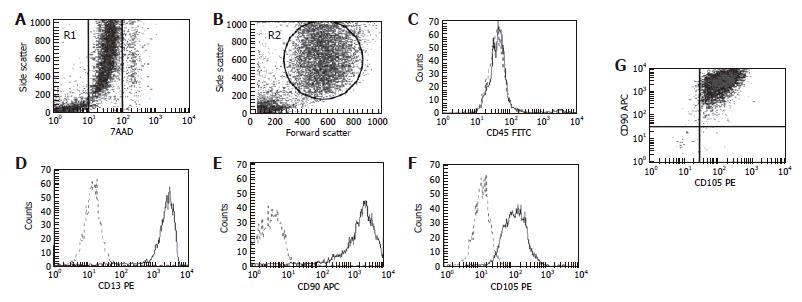
Figure 2 Flow cytometry analysis of surface protein markers of BMSC.
Two analytical regions were established combining R1 region (A), which selects viable cells, and R2 (B) in forward and side characteristics of BMSC. Surface antigen markers were positive vis-à-vis isotypic controls for CD13 (D), CD90 (E) and CD105 (F) and negative for CD45 (C). Co-expression of CD90-CD105 is shown in dot-plots (G). 7ADD: 7-Aminoactinomicyn D.
Figure 3 Flow cytometry analysis of surface protein markers of ADSC.
Two analytical regions were established combining R1 region (A), which selects viable cells, and R2 (B) in forward and side characteristics of ADSC. Surface antigen markers were positive vis-à-vis isotypic controls for CD13 (D), CD90 (E) and CD105 (F) and negative for CD45 (C). Co-expression of CD90-CD105 is shown in dot-plots (G). 7ADD: 7-Aminoactinomicyn D.
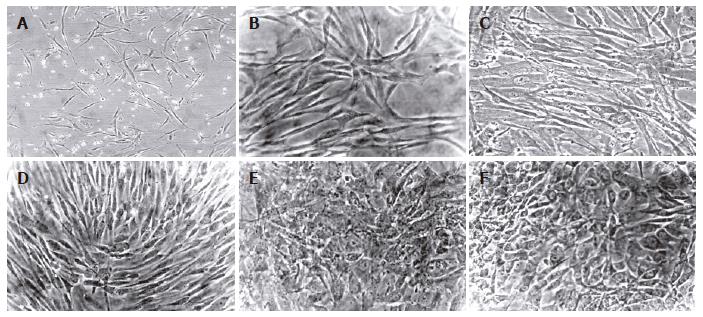
Figure 4 Morphology of human mesenchymal stem cells from bone marrow and adipose tissue during the differentiation protocol.
Cells were induced to differentiate by using a sequential addition of growth factors, cytokines and hormones. Morphology of passage 2 BMSC (A) and ADSC (B) cells. No significant morphological changes were observed in BMSC (C) nor in ADSC (D) cells during the step-1 differentiation. However, both BMSC (E) and ADSC (F) cells significantly changed the morphology, and developed a polygonal shape during step-2 differentiation (magnification 20 x for all pictures).
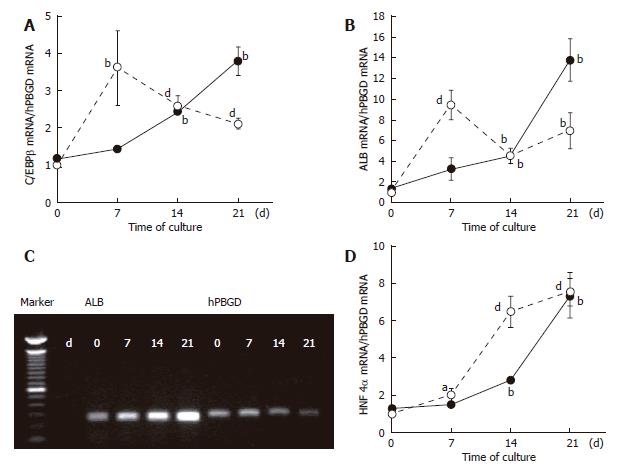
Figure 5 Real-time PCR analysis of the expression of mRNA for liver markers determined at established times in the transdifferentiation protocol of BMSC and ADSC.
Expression of C/EBPβ (A) (liver-enriched transcription factor, that plays important roles in regulating the expression of hepatic genes), albumin (B and C) and HNF4α (D), were analysed in BMSC (bold symbols) and ADSC (clear symbols) at different time points of the differentiation protocol. Data are shown as the fold increase in the mRNA level compared to the undifferentiated cells (d 0 of the differentiation protocol), and were normalized by hPBGD. The agarose gel shows the ALB expression of BMSC (C). HNF4α: hepatocyte nuclear factor 4 alpha; C/EBPβ: CCAAT / enhancer binding protein beta; ALB: albumin. Data are the mean ± SE of 5 and 6 different cultures of BMSC and ADSC respectively. aP < 0.05; bP < 0.01; dP < 0.001.
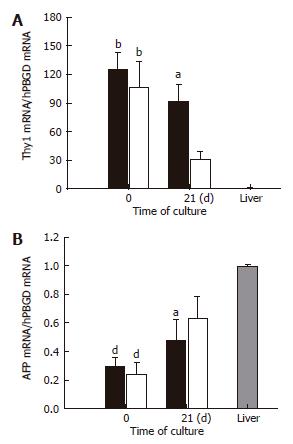
Figure 6 Real-time PCR analysis of the expressions of mRNA for Thy1 and alphafetoprotein in BMSC and ADSC.
The levels of Thy1 (CD90) (A) and the alphafetoprotein (B) expression in differentiated BMSC (black bars) and ADSC (clear bars) were quantified by RT-PCR at the initial and final times of the differentiation protocol, and compared with that of human pooled liver tissue from a liver bank. Data are shown as a fold increase in the mRNA level compared to the liver tissue and normalized by hPBGD. AFP, alphafetoprotein. Data are the mean ± SE of 4 different cultures of BMSC and ADSC. aP < 0.05; bP < 0.01; dP < 0.001.
Figure 7 Real-time PCR analysis of the expression of mRNA for CYP2E1 and CYP3A4 in BMSC and ADSC.
The expression of two major drug metabolising enzymes, CYP2E1 (A) and CYP3A4 (B), in BMSC (black bars) and ADSC (clear bars) were quantified by RT-PCR at the initial and final times of the differentiation protocol, and compared with that of the human hepatoma cells HepG2. The agarose gel shows the CYP3A4 expression of ADSC (C). Data are shown as a fold increase in the mRNA level compared to HepG2, and were normalized by hPBGD. Data are the mean ± SE of 3 different cultures of BMSC and ADSC. bP < 0.01; dP < 0.001.
Figure 8 Evaluation of the role of C/EBP transcription factors in the differentiation of BMSC and ADSC cells.
Adenoviral transduction caused a dose-dependent increase in the level of C/EBPβ mRNA, as assessed by real-time PCR analysis (A). Concomitantly, an up-regulation of CYP3A4 was observed which was more significant in ADSCs (B), and was paralleled by a significant down-regulation of the mesenchymal cells marker Thy1 in both BMSC and ADSC (C). Controls were not transduced. Data are shown as a fold increase in the mRNA level compared to the control and normalized by hPBGD. Data are the mean ± SE of 3 different cultures of BMSC and ADSC.
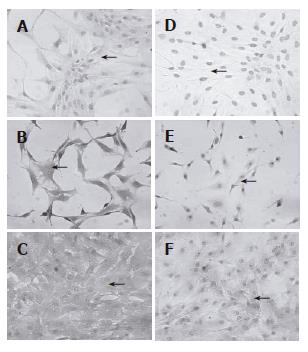
Figure 9 Immunohistochemical analysis of albumin and alphafetoprotein in ADSC cells.
Homogeneous expression of albumin (A-C) and AFP (D-F) in ADSC cells was further confirmed by immunocytochemistry. Staining for both albumin and AFP was negative in undifferentiated cells (A,D). ADSC cells homogeneously increase their protein expression levels in response to the differentiation protocol. Positive staining was shown after 14 d (B, E) and 21 d (C, F) of the 2-step differentiation protocol. AFP; alphafetoprotein.
- Citation: Taléns-Visconti R, Bonora A, Jover R, Mirabet V, Carbonell F, Castell JV, Gómez-Lechón MJ. Hepatogenic differentiation of human mesenchymal stem cells from adipose tissue in comparison with bone marrow mesenchymal stem cells. World J Gastroenterol 2006; 12(36): 5834-5845
- URL: https://www.wjgnet.com/1007-9327/full/v12/i36/5834.htm
- DOI: https://dx.doi.org/10.3748/wjg.v12.i36.5834


