Copyright
©2006 Baishideng Publishing Group Co.
World J Gastroenterol. Sep 21, 2006; 12(35): 5680-5686
Published online Sep 21, 2006. doi: 10.3748/wjg.v12.i35.5680
Published online Sep 21, 2006. doi: 10.3748/wjg.v12.i35.5680
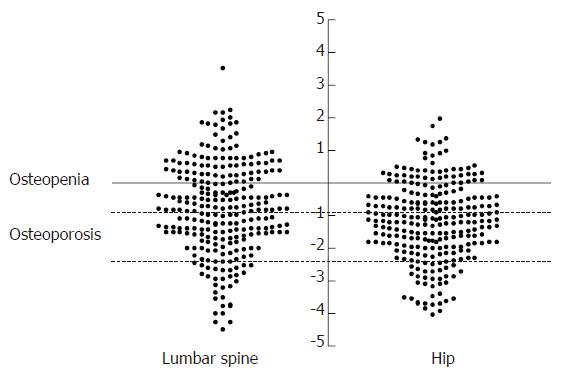
Figure 1 Scatterplot of T score values at the lumbar spine and hip.
Dotted lines represent thresholds for diagnosis of osteopenia and osteoporosis.
- Citation: Bartram SA, Peaston RT, Rawlings DJ, Walshaw D, Francis RM, Thompson NP. Mutifactorial analysis of risk factors for reduced bone mineral density in patients with Crohn’s disease. World J Gastroenterol 2006; 12(35): 5680-5686
- URL: https://www.wjgnet.com/1007-9327/full/v12/i35/5680.htm
- DOI: https://dx.doi.org/10.3748/wjg.v12.i35.5680


