Copyright
©2006 Baishideng Publishing Group Co.
World J Gastroenterol. Sep 21, 2006; 12(35): 5644-5650
Published online Sep 21, 2006. doi: 10.3748/wjg.v12.i35.5644
Published online Sep 21, 2006. doi: 10.3748/wjg.v12.i35.5644
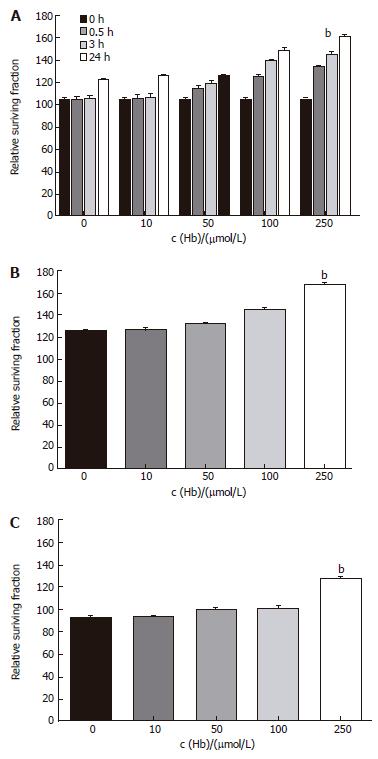
Figure 1 Time-course and dose-response effects of hemoglobin on apoptosis of colorectal cancer cell lines.
A: HT-29 cell line. bP = 0.000 vs 0 μmol/L; B: Lovo cell line. bP = 0.000 vs 0 μmol/L; C: CCL-33Co cell line. bP = 0.000 vs 0 μmol/L.
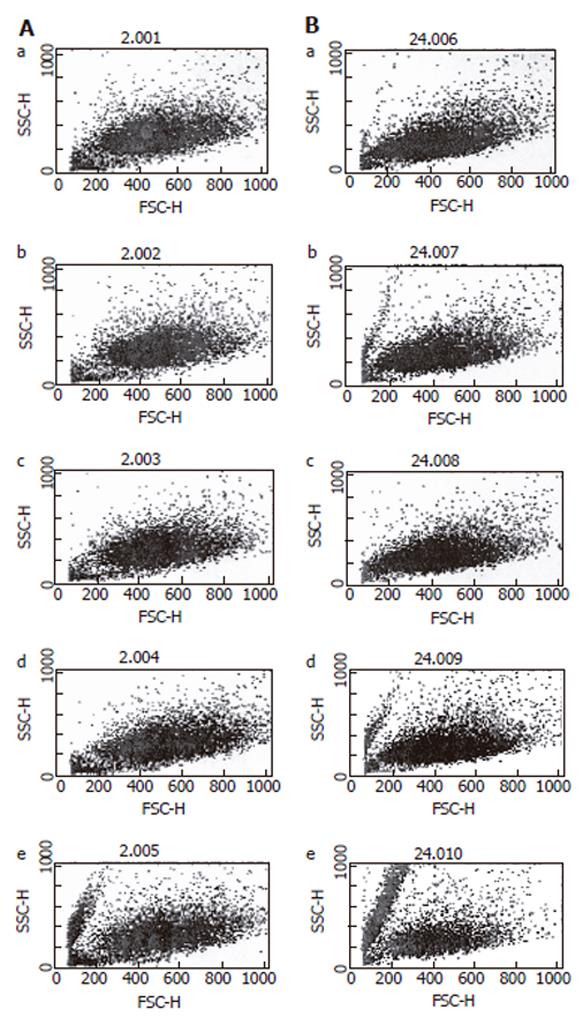
Figure 2 Flowcytometry of reactive oxygen species on HT-29 cells.
A: After 3 h of hemoglobin administration; B: After 24 h of hemoglobin administration. a: Hb 0 μmol/L; b: Hb 10 μmol/L; c: Hb 50 μmol/L; d: Hb 100 μmol/L; e: Hb 250 μmol/L.
Figure 3 Relative surviving fraction of cell lines at 24 h after simultaneously adding each concentration of 5-fluorouracil.
A: HT-29 cell line. bP = 0.001 vs Control; B: Lovo cell line. bP = 0.003 vs Control; C: CCL-33Co cell line. aP = 0.039 vs Control.
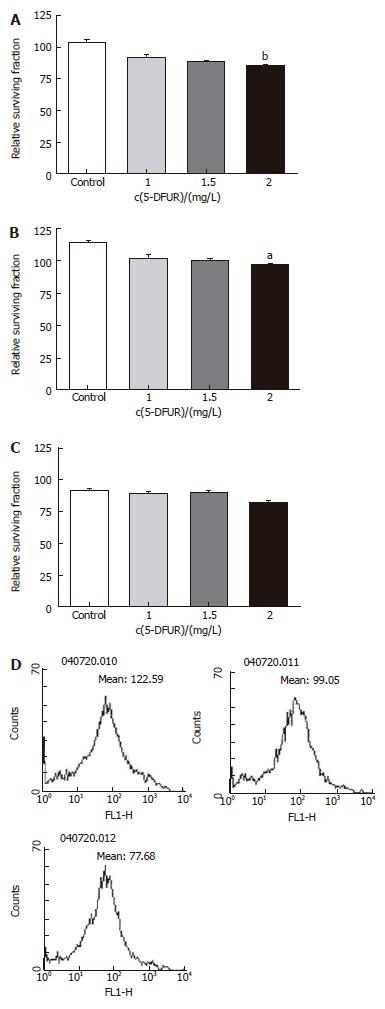
Figure 4 Relative surviving fraction of cell lines at 24 h after simultaneously adding each concentration of 5-DFUR.
A: HT-29 cell line. bP = 0.001 vs Control; B: Lovo cell line. bP = 0.003 vs Control; C: CCL-33Co cell line. bP = 0.010 vs Control.
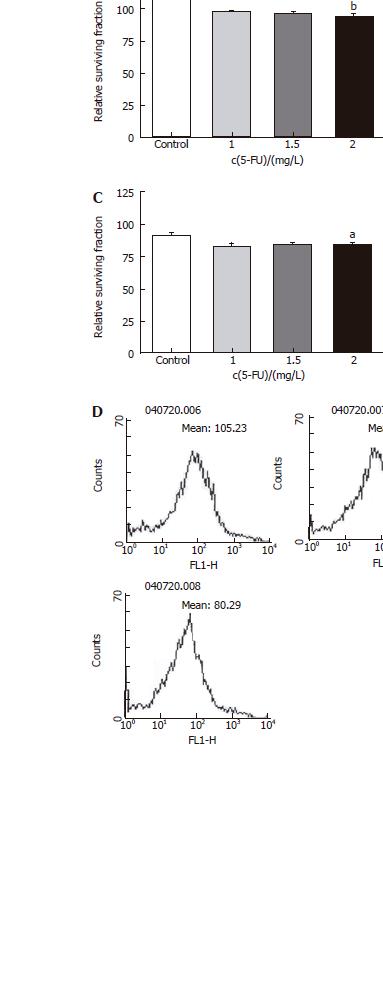
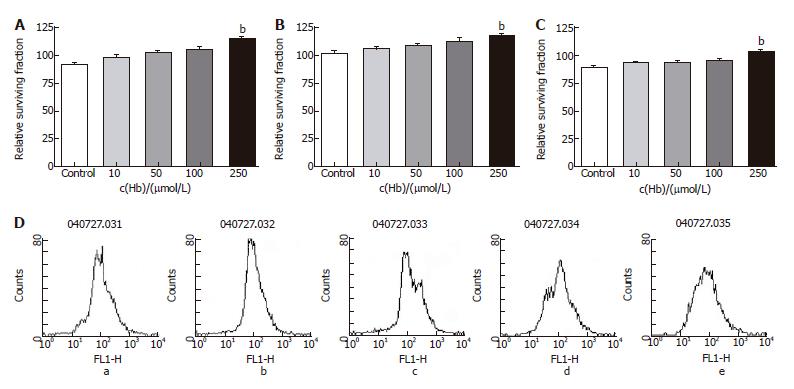
Figure 5 Relative surviving fraction of cell lines after adding 5-FU (1 mg/L) and each concentration of hemoglobin.
A: HT-29 cell line. bP = 0.004 vs Control; B: Lovo cell line. bP = 0.000 vs Control; C: CCL-33Co cell line. bP = 0.005 vs Control; D: Flowcytometry of HT-29 cell line. a: Hb 0 μmol/L; b: Hb 10 μmol/L; c: Hb 50 μmol/L; d: Hb 100 μmol/L; e: Hb 250 μmol/L.
Figure 6 Relative surviving fraction of cell lines after adding 5-DFUR (1 mg/L) and each concentration of hemoglobin.
A: HT-29 cell line. bP = 0.000 vs Control; B: Lovo cell line. bP = 0.006 vs Control; C: CCL-33Co cell line. bP = 0.000 vs Control; D: Flowcytometry of HT-29. a: Hb 0 μmol/L; b: Hb 10 μmol/L; c: Hb 50 μmol/L; d: Hb 100 μmol/L; e: Hb 250 μmol/L.
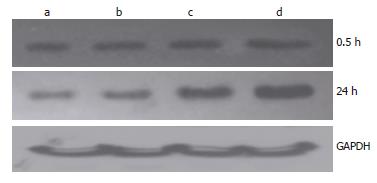
Figure 7 Change of Prx1 expression after administration of hemoglobin.
a: Hb 0 μmol/L; b: Hb 10 μmol/L; c: Hb 100 μmol/L; d: Hb 250 μmol/L.
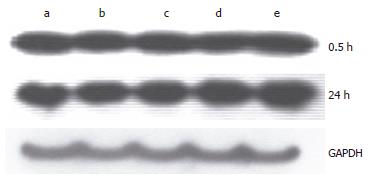
Figure 8 Change of SOD1 expression after administration of hemoglobin.
a: Hb 0 μmol/L; b: Hb 10 μmol/L; c: Hb 50 μmol/L; d: Hb 100 μmol/L; e: Hb 250 μmol/L.
- Citation: Lee RA, Kim HA, Kang BY, Kim KH. Hemoglobin induces colon cancer cell proliferation by release of reactive oxygen species. World J Gastroenterol 2006; 12(35): 5644-5650
- URL: https://www.wjgnet.com/1007-9327/full/v12/i35/5644.htm
- DOI: https://dx.doi.org/10.3748/wjg.v12.i35.5644


