Copyright
©2006 Baishideng Publishing Group Co.
World J Gastroenterol. Sep 7, 2006; 12(33): 5287-5292
Published online Sep 7, 2006. doi: 10.3748/wjg.v12.i33.5287
Published online Sep 7, 2006. doi: 10.3748/wjg.v12.i33.5287
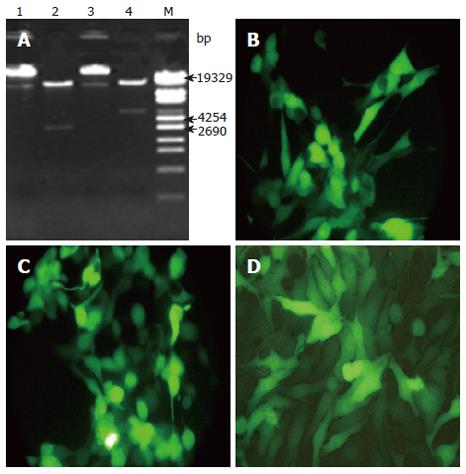
Figure 1 M: DNA Marker; Lanes 1, 3: Recombinant adenoviral plasmids pAd-IκBαM/pAd-IκBα un-cleaved with PacI; Lanes 2, 4: Recombinant adenoviral plasmids pAd-IκBαM/pAd-IκBα cleaved with PacI.
A: Indentification of recombinant adenoviral plasmids by restriction analysis; B, C: The pAd-IκBαM/pAd-IκBα was transfected into 293 cells and GFP expression was observed by fluorescence microscopy after transfection for 36 h; B: pAd-IκBαM; C: pAd-IκBα (× 200). D: The recombinant adenovirus AdIκBαM infected into HepG2 and GFP expression was visualized by fluorescence microscopy after transfection for 48 h, (× 200).
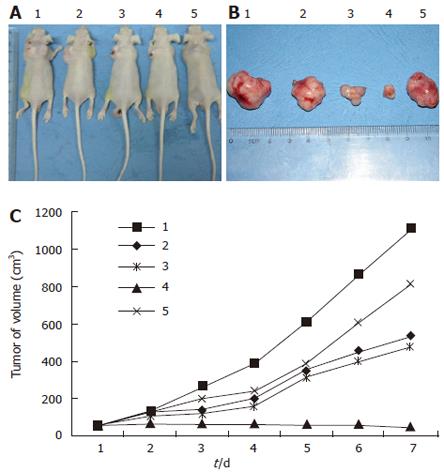
Figure 2 A: Mice were killed on the fourth day after different injections (1: Control PBS, 2: AdIκBαM 2 × 10¹⁰, 3: AdIκBαM 2 × 10¹¹, 4: AdIκBαM 2 × 10¹², 5: AdIκBα 2 × 10¹²); B: Tumors from mice were processed for histologic analysis.
The sequence of mice is according to that in A; C: The tumor growth curve. The sequence of mice is according to that in A, B.
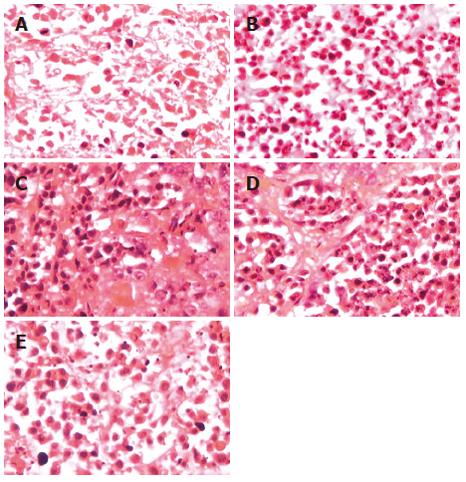
Figure 3 Morphological changes of HepG2 cells from mice treated with different methods were analyzed by HE staining.
A: PBS control; B: AdIκBαM (2 × 10¹⁰); C: AdIκBαM (2 × 10¹¹); D: AdIκBαM (2 × 10¹²); E: AdIκBα (2 × 10¹²).
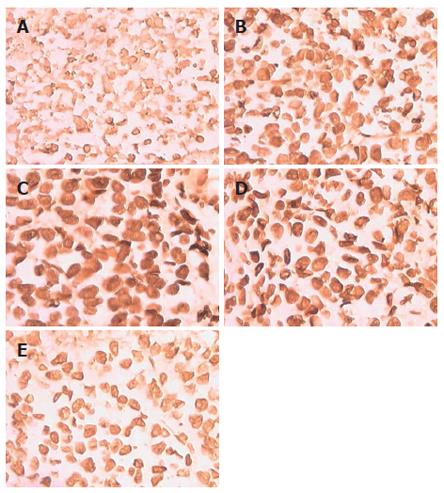
Figure 4 TUNEL was used to evaluate apoptosis of HepG2 cells in BALB/c mice.
A: PBS control; B: AdIκBαM (2 × 10¹⁰ pfu/L); C: AdIκBαM (2 × 10¹¹ pfu/L); D: AdIκBαM (2 × 10¹² pfu/L); E: AdIκBα (2 × 10¹² pfu/L).
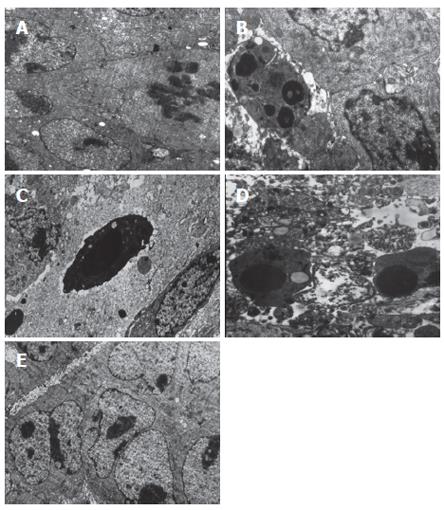
Figure 5 Electron microscopic analysis was used to evaluate apoptosis in HepG2 cells in mice.
A: PBS control (× 4000); B: AdIκBαM 2 × 10¹⁰ pfu/L (× 6000); C: AdIκBαM 2 × 10¹¹ pfu/L (6000 ×); D: AdIκBαM 2 × 10¹² pfu/L (× 6000); E: AdIκBα 2 × 10¹² pfu/L (× 4000).
- Citation: Li TJ, Jia LP, Gao XL, Huang AL. Gene therapy that inhibits NF-κB results in apoptosis of human hepatocarcinoma by recombinant adenovirus. World J Gastroenterol 2006; 12(33): 5287-5292
- URL: https://www.wjgnet.com/1007-9327/full/v12/i33/5287.htm
- DOI: https://dx.doi.org/10.3748/wjg.v12.i33.5287


