Copyright
©2006 Baishideng Publishing Group Co.
World J Gastroenterol. Aug 28, 2006; 12(32): 5153-5159
Published online Aug 28, 2006. doi: 10.3748/wjg.v12.i32.5153
Published online Aug 28, 2006. doi: 10.3748/wjg.v12.i32.5153
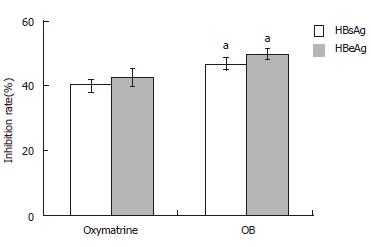
Figure 1 The inhibition rate of OB on HBsAg and HBeAg secretion in the 2.
2.15 cell culture system. n = 3, mean ± SD. aP < 0.05 vs oxymatrine.
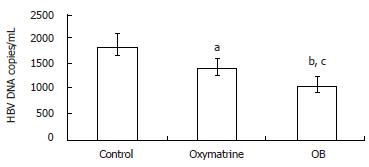
Figure 2 The effect of OB on the HBV DNA level in the 2.
2.15 culture system. n = 3, mean ± SD. aP < 0.05, bP < 0.01 vs control, cP < 0.05 vs oxymatrine.
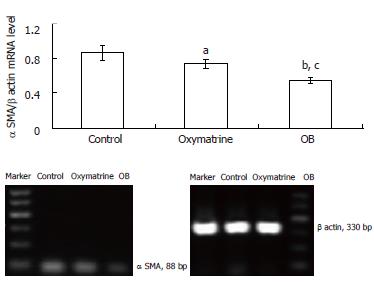
Figure 3 Effect of OB treatment on the α SMA mRNA level in HSC-T6 cells.
The α SMA mRNA level was determined by semi quantitative RT-PCR analysis and corrected by β actin mRNA level. n = 3, mean ± SD. aP < 0.05, bP < 0.01 vs control, cP < 0.05 vs oxymatrine.
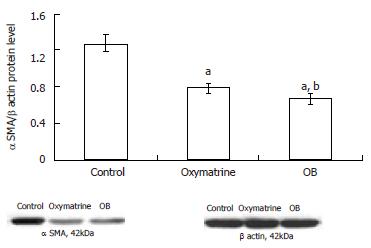
Figure 4 Effect of OB treatment on the α SMA protein level in HSC-T6 cells.
The α SMA protein level was determined by Western blot analysis and corrected by β actin protein level. n = 3, mean ± SD. bP < 0.01 vs control, aP < 0.05 vs oxymatrine.
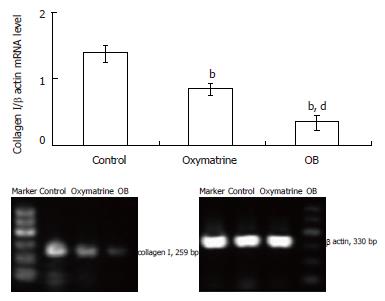
Figure 5 Effect of OB treatment on the Collagen I mRNA level in HSC-T6 cells.
The collagen mRNA level was determined by semi quantitative RT-PCR analysis and corrected by the β actin mRNA level. mean ± SD. bP < 0.01 vs control, dP < 0.01 vs oxymatrine.
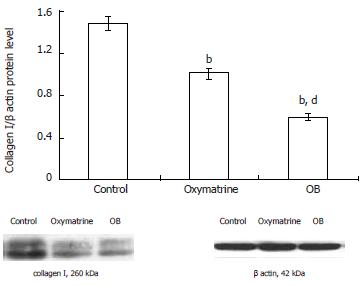
Figure 6 Effect of OB treatment on the collagen I protein level in HSC-T6 cells.
The collagen protein level was determined by Western blot analysis and corrected by the β actin protein level. n = 3, mean ± SD. bP < 0.01 vs control, dP < 0.01 vs oxymatrine.
- Citation: Cheng Y, Ping J, Xu HD, Fu HJ, Zhou ZH. Synergistic effect of a novel oxymatrine-baicalin combination against hepatitis B virus replication, α smooth muscle actin expression and type I collagen synthesis in vitro. World J Gastroenterol 2006; 12(32): 5153-5159
- URL: https://www.wjgnet.com/1007-9327/full/v12/i32/5153.htm
- DOI: https://dx.doi.org/10.3748/wjg.v12.i32.5153


