Copyright
©2006 Baishideng Publishing Group Co.
World J Gastroenterol. Aug 21, 2006; 12(31): 4986-4995
Published online Aug 21, 2006. doi: 10.3748/wjg.v12.i31.4986
Published online Aug 21, 2006. doi: 10.3748/wjg.v12.i31.4986
Figure 5 Immunoblot assay of TRAF2 and NIK.
pUC119 is a backbone DNA about pHBV1.2x. In the HepG2 cells transfected with pHBV1.2x, the protein levels of NIK (A) and TRAF2 (B) were increased. β-actin was used to normalize total protein level.
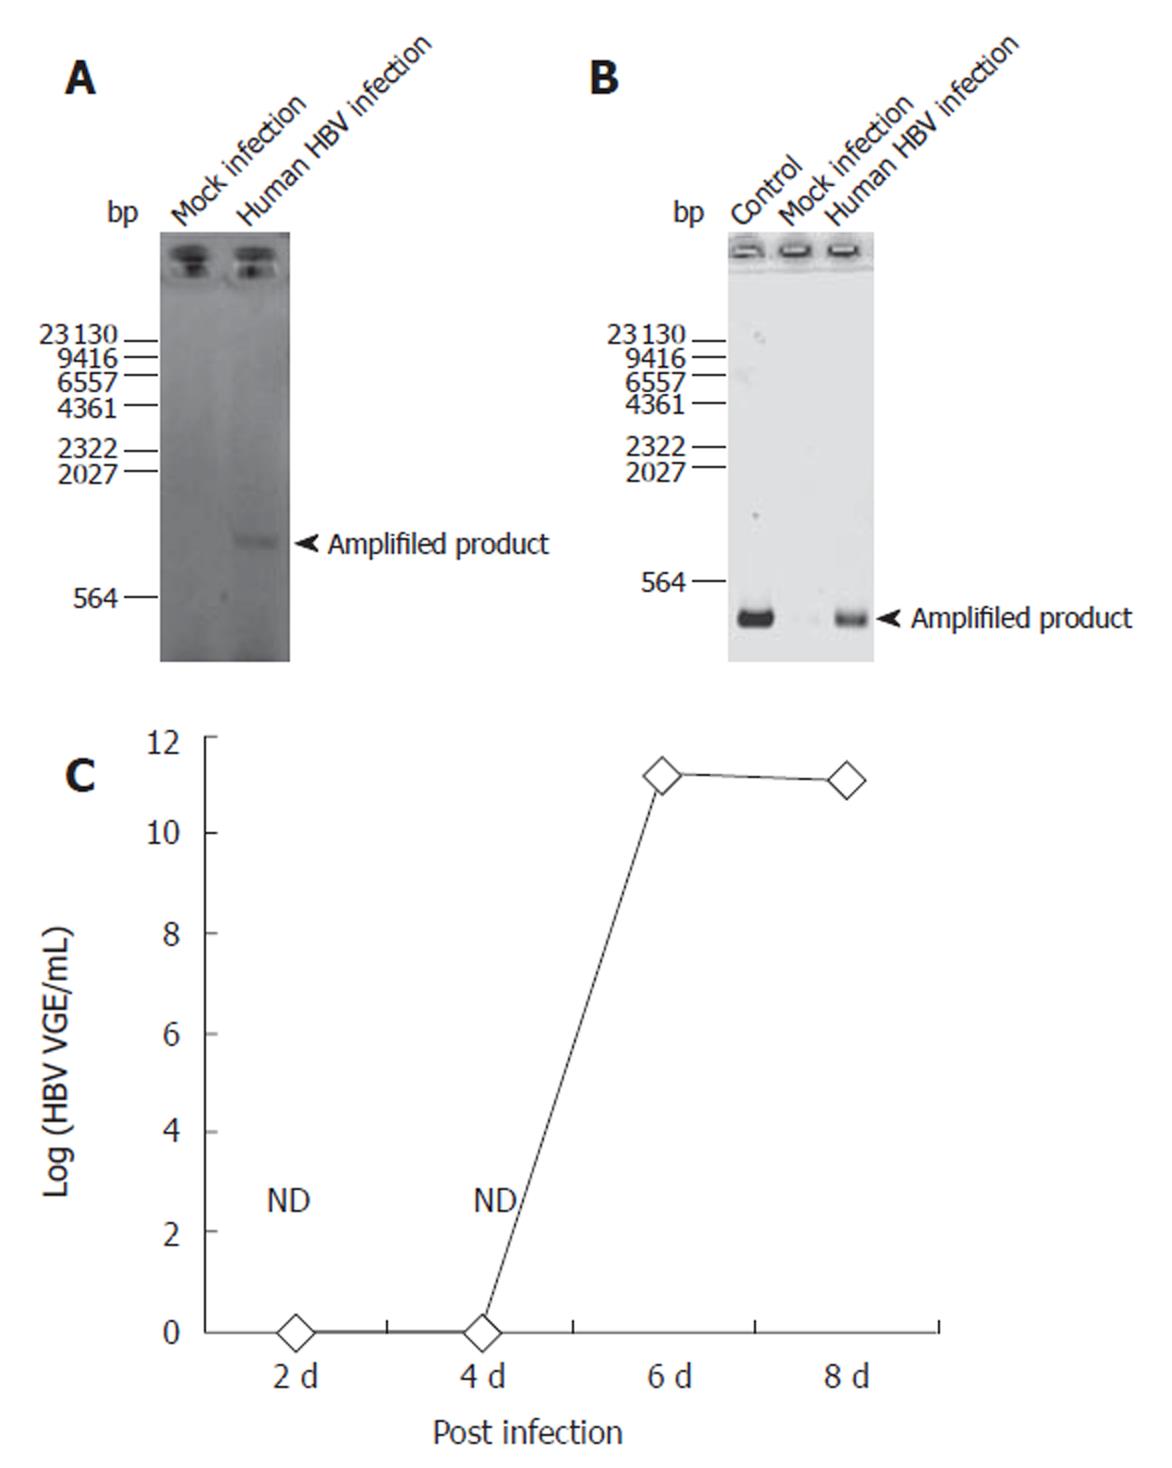
Figure 1 Confirmation of HBV infection for PNHHs using PCR for cccDNA formation and RT-PCR for production of transcripts.
From PNHHs infected with HBV, RNA and DNA were extracted using TRIzol reagent as described in Materials and Methods. As a negative control, mock-infected PNHHs were used. A: With the extracted DNA, cccDNA was confirmed by a PCR analysis as described in Materials and Methods; B: With the extracted RNA, a transcript of HBV was confirmed by RT-PCR analysis as described in Materials and Methods; C: With the extracted RNA, a tanscript of HBV was confirmed by real-time PCR as previously described[19].
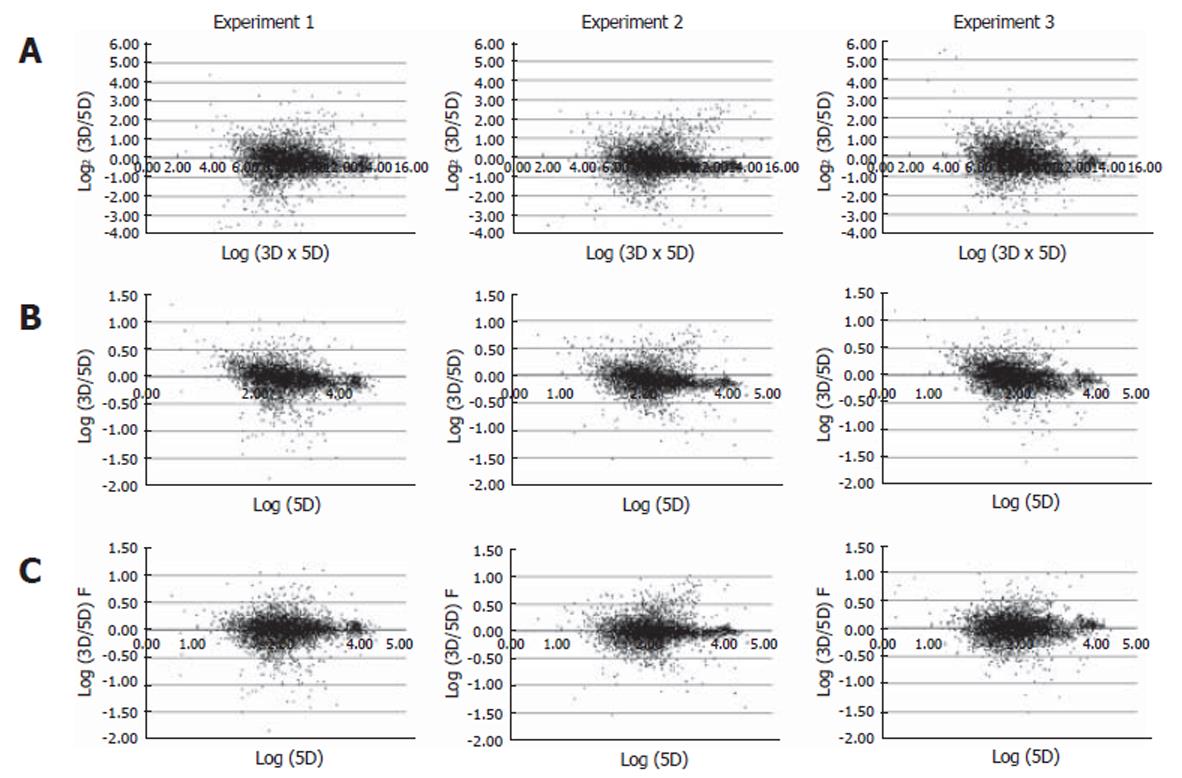
Figure 2 Scatter plot analysis.
For normalization of the Cy3 (3D) and Cy5 channel signal (5D) channels, data obtained from the raw image scanning were plotted in a scatter plot using Excel software (Microsoft). A: The X-axis represents Log2 (3D/5D) and the Y-axis Log2 (3D/5D); B: The X-axis represents Log (5D) and the Y-axis Log (3D/5D); C: The X-axis represents Log (5D) and the Y-axis Log (3D/5D) F, in which “F” is the function for normalization. The bottom panel shows data with signals fitted to an exponential decay curve.
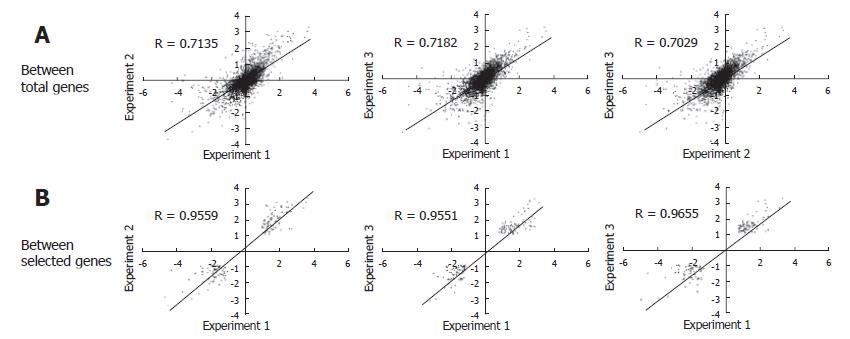
Figure 3 Correlation between three sets of PNHHs infected for eight days.
A: With the reliable signals in obtained signals, the correlation efficient was calculated between each experiment; B: In addition, another correlation efficient was also calculated with only the selected genes, which were differentially expressed more than 2 folds.
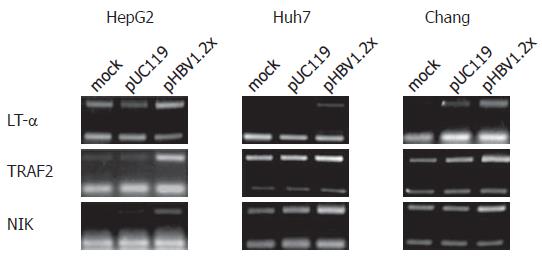
Figure 4 RT-PCR analysis of selected genes.
Mock means untransfected cells. pUC119 is backbone of pHBV1.2x, so pUC119 transfected cells are the negative control for pHBV1.2x transfected cell. In the hepatoma-derived cell lines, HepG2, Huh7, and Chang liver cells, TRAF2, NIK, and LT-α mRNA level in pHBV1.2x transfected cells were up-regulated rather than mock and pUC119 transfected cells.
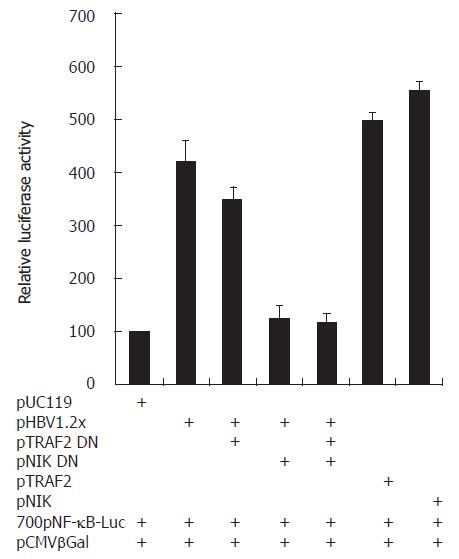
Figure 6 HBV-mediated NF-κB activation through TRAF2 and NIK.
In pHBV1.2x transfected HepG2 cells, NF-κB activity was increased more than pUC119 transfected cells. But in cotransfected cells with pHBV1.2x and TRAF2 DN or NIK DN, NF-κB activity was decreased less than pHBV1.2x transfected cells.
- Citation: Ryu HM, Park SG, Yea SS, Jang WH, Yang YI, Jung G. Gene expression analysis of primary normal human hepatocytes infected with human hepatitis B virus. World J Gastroenterol 2006; 12(31): 4986-4995
- URL: https://www.wjgnet.com/1007-9327/full/v12/i31/4986.htm
- DOI: https://dx.doi.org/10.3748/wjg.v12.i31.4986


