Copyright
©2006 Baishideng Publishing Group Co.
World J Gastroenterol. Aug 21, 2006; 12(31): 4973-4980
Published online Aug 21, 2006. doi: 10.3748/wjg.v12.i31.4973
Published online Aug 21, 2006. doi: 10.3748/wjg.v12.i31.4973
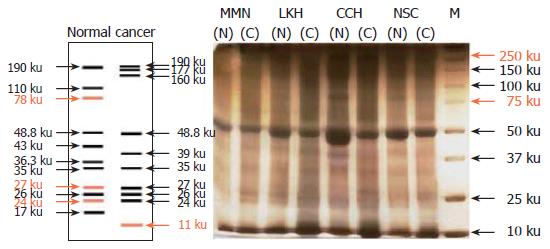
Figure 1 Proteins profiles of normal and cancer colon tissues from four different patients.
The proteins were extracted using in S1 buffer. N: Normal colon tissues; C: Cancer colon tissues; M: Marker; Lanes 1 and 2: MMN samples; Lanes 3 and 4: LKH samples; Lanes 5 and 6: CCH samples and Lanes 7 and 8: NSC samples. Diagram 1 shows the consistent protein bands found in the normal and the cancer tissues of the figure.
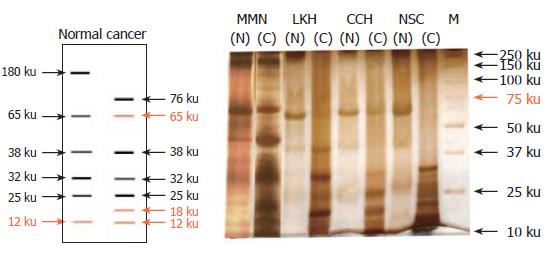
Figure 2 Proteins profiles of normal and cancer colon tissues from four different patients.
The proteins were extracted using in S2 buffer. N: Normal colon tissues; C: Cancer colon tissues; M: Marker; Lanes 1 and 2: MMN samples; Lanes 3 and 4: LKH samples; Lanes 5 and 6: CCH samples and Lanes 7 and 8: NSC samples. Diagram 2 shows the consistent protein bands found in the normal and the cancer tissues of the figure.
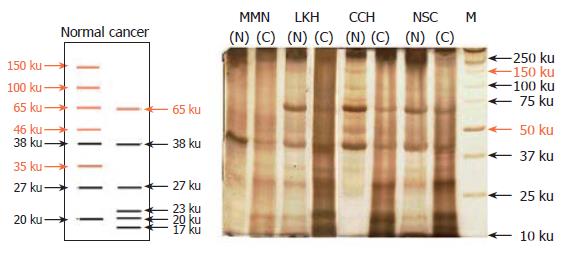
Figure 3 Proteins profiles of normal and cancer colon tissues from four different patients.
The proteins were extracted using in S3 buffer. N: Normal colon tissues; C: Cancer colon tissues; M: Marker; Lanes 1 and 2: MMN samples; Lanes 3 and 4: LKH samples; Lanes 5 and 6: CCH samples and Lanes 7 and 8: NSC samples. Diagram 3 shows the consistent protein bands found in the normal and the cancer tissues of the figure.
- Citation: Gam LH, Leow CH, Man CN, Gooi BH, Singh M. Analysis of differentially expressed proteins in cancerous and normal colonic tissues. World J Gastroenterol 2006; 12(31): 4973-4980
- URL: https://www.wjgnet.com/1007-9327/full/v12/i31/4973.htm
- DOI: https://dx.doi.org/10.3748/wjg.v12.i31.4973


