Copyright
©2006 Baishideng Publishing Group Co.
World J Gastroenterol. Jul 21, 2006; 12(27): 4331-4337
Published online Jul 21, 2006. doi: 10.3748/wjg.v12.i27.4331
Published online Jul 21, 2006. doi: 10.3748/wjg.v12.i27.4331
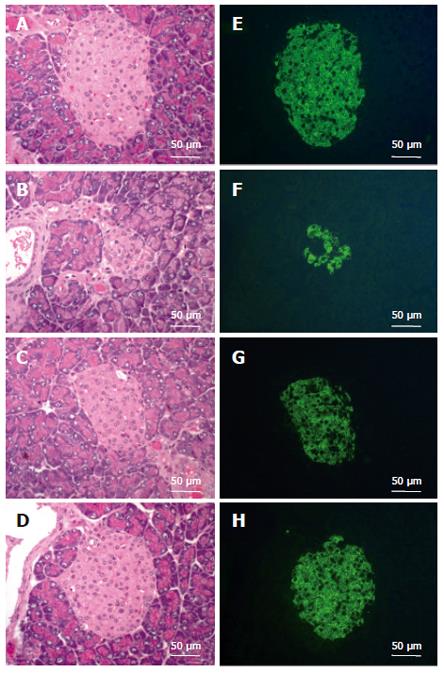
Figure 1 Protection of islets from STZ-induced destruction by CCE.
Pancreases were obtained from normal controls (A, E), from STZ-injected (B, F), and from CCE pretreated for 7 d with concentrations of 100 mg/kg per day (C, G) or 250 mg/kg (D, H) subsequently injected with STZ. Islets were labeled with insulin antibody and FITC-labeled anti-guinea pig IgG, and examined by fluorescence microscopy (E-H). The cellular morphologies of these same islets and of adjoining exocrine regions were counterstained with H-E (A-D). Bar = 50 μm.
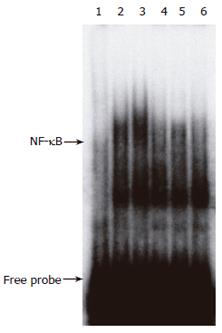
Figure 2 Inhibition of NF-κB activation in pancreas by CCE pretreatment.
Mice were injected with citrate buffer, STZ, or STZ plus CCE. Nuclear proteins isolated from pancreas taken at 30 min after STZ injection (100 mg/kg) were analyzed by EMSA. To confirm reaction specificity, the same experiment was done in the presence of a 50-fold excess of unlabeled oligo probes. Representative result from three independent experiments is shown. lane 1: negative control using 50-fold excess of κB oligonucleotide as a negative competitor; lane 2:citrate buffer; lane 3: STZ; lane 4:STZ + 100 mg/kg CCE; lane 5: STZ + 250 mg/kg CCE; lane 6, STZ + 500 mg/kg CCE.
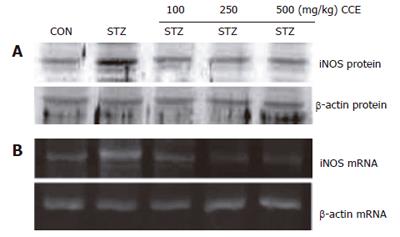
Figure 3 Expression of iNOS protein and mRNA induced by STZ in mice pancreases.
Mice were injected with STZ (100 mg/kg) after being pretreated for 7 d with various concentrations of CCE. iNOS protein (A) and mRNA (B) were isolated and detected by Western blotting and RT-PCR, respectively. Representative results from three independent experiments are shown.
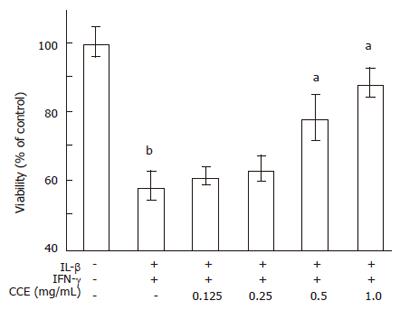
Figure 4 Prevention of cytokine-induced cell death by CCE.
RINm5F cells (1 × 10⁵) were incubated with cytokines in the presence or absence of CCE for 24 h. The concentrations of cytokines used were: IL-1β, 2 ng/mL and IFN-γ, 100 U/mL. The percentages of viable cells after these treatments were determined by using MTT colorimetric assays and were calculated versus the A570 values of untreated control cells. Value are means ± SE of four independent experiments. bP < 0.01 vs control; aP < 0.05 vs cytokines.
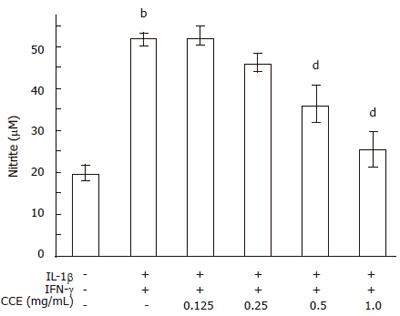
Figure 5 Effect of CCE on cytokine-induced NO production in RINm5F cells.
RINm5F cells (5 × 10⁵) were treated with cytokines with or without the indicated concentrations of CCE. The concentrations of cytokines used were same as those in Figure 4. Following 24 h of incubation, nitrite concentrations (indicative of NO synthesis) were measured in cell-free culture supernatants. Results of triplicate samples are expressed as means ± SE of four independent experiments. bP < 0.01 vs control; dP < 0.01 vs cytokines.
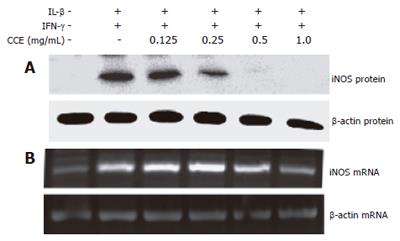
Figure 6 Effect of CCE on cytokine-induced iNOS protein and mRNA expression in RINm5F cells.
RINm5F cells (1 × 10⁶) were cultured in 6-well plates and treated with cytokines with or without CCE for 24 h, and then analyzed by Western blotting (A) or RT-PCR (B), as described in “Materials and Methods”. The concentrations of the cytokines used were as described in Figure 4. Results are representative of three independent experiments.
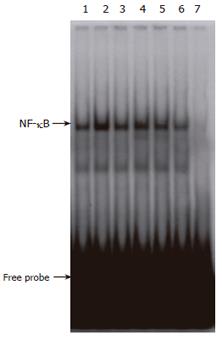
Figure 7 Effect of CCE on the cytokine-induced translocation of NF-κB from cytosol to the nucleus.
RINm5F cells (5 × 10⁶) were treated with cytokines in the presence or absence of CCE. Following 30 min of incubation, nuclear extracts were prepared and NF-κB activation levels were analyzed by EMSA, as described in “Materials and Methods”. The concentrations of cytokines used were the same as in Figure 4. Results representative of three independent experiments are shown. Lane 1: none; lane 2: IL-1β + IFN-γ; lane 3: IL-1β + IFN-γ + 0.125 mg/mL CCE; lane 4: IL-1β+ IFN-γ + 0.25 mg/mL CCE; lane 5, IL-1β + IFN-γ + 0.5 mg/mL CCE; lane 6, IL-1β + IFN-γ + 1.0 mg/mL CCE; lane 7: negative control using 50-fold excess of κB oligonucleotide as a negative competitor.
-
Citation: Kwon KB, Kim EK, Jeong ES, Lee YH, Lee YR, Park JW, Ryu DG, Park BH.
Cortex cinnamomi extract prevents streptozotocin- and cytokine-induced β-cell damage by inhibiting NF-κB. World J Gastroenterol 2006; 12(27): 4331-4337 - URL: https://www.wjgnet.com/1007-9327/full/v12/i27/4331.htm
- DOI: https://dx.doi.org/10.3748/wjg.v12.i27.4331


