Copyright
©2006 Baishideng Publishing Group Co.
World J Gastroenterol. Jul 14, 2006; 12(26): 4149-4155
Published online Jul 14, 2006. doi: 10.3748/wjg.v12.i26.4149
Published online Jul 14, 2006. doi: 10.3748/wjg.v12.i26.4149
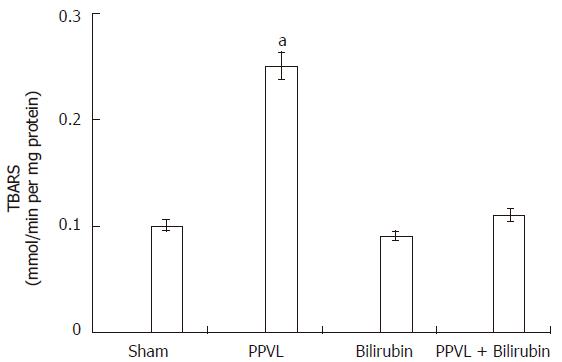
Figure 1 Effect of PPVL and bilirubin on lipid peroxidation.
Rats were treated as described in Methods. Values are the means of three different experiments using three rats each time, and bars indicate SE. aP < 0.05 vs sham.
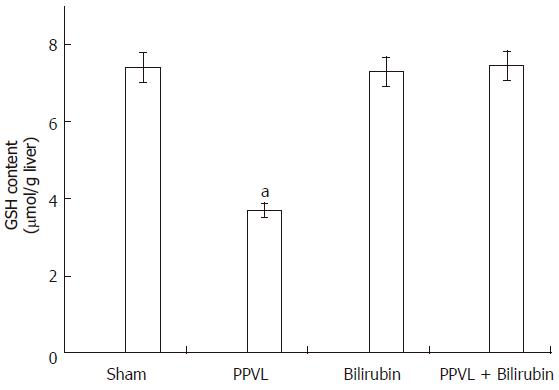
Figure 2 Effect of PPVL and bilirubin on GSH liver content.
Rats were treated as described in Methods. Values are the means of three different experiments using three rats each time, and bars indicate SE. aP < 0.05 vs sham.
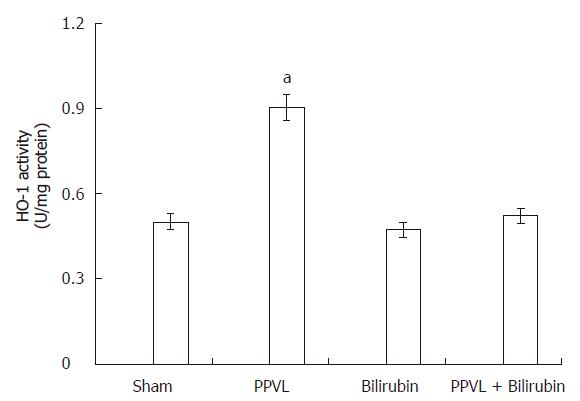
Figure 3 Effect of PPVL and bilirubin on HO-1 activity.
Rats were treated as described in Methods. One unit of HO-1 is defined as the amount of enzyme producing 1 nmol of bilirubin per 30 min under the standard incubation conditions. Values are the means of three different experiments using three rats each time, and bars indicate SE. aP < 0.05 vs sham.
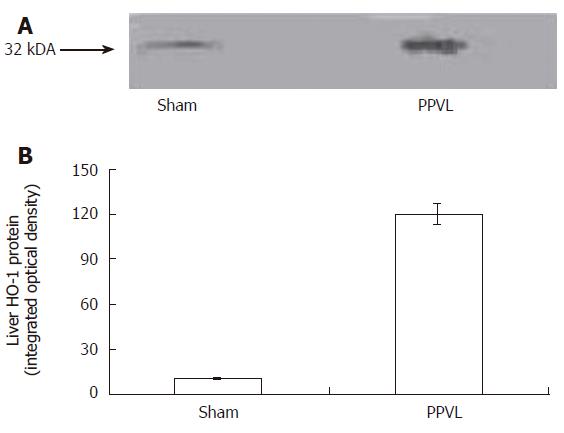
Figure 4 Western blot analysis of HO-1 expression in PPVL rat liver (A).
Densitometry was done to quantify HO-1 protein expression (B). The blot is representative of 3 blots with a total of 4-5 samples/group between the 3 blots. P < 0.01 sham vs PPVL group.
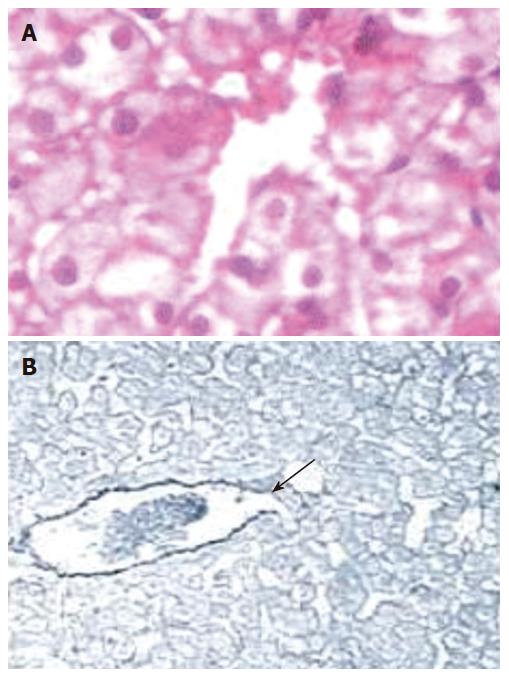
Figure 5 Hepatic centrolobular zone of Sham operated rats (A).
Sinusoidal area spread normal histological features (HE, 100 x magnification). Hepatic centrolobular zone corresponding to PPVL group (B). Sinusoidal area is increased (arrows) (Reticulin, enhanced image, 40 x magnification).
- Citation: Gonzales S, Pérez MJ, Perazzo JC, Tomaro ML. Antioxidant role of heme oxygenase-1 in prehepatic portal hypertensive rats. World J Gastroenterol 2006; 12(26): 4149-4155
- URL: https://www.wjgnet.com/1007-9327/full/v12/i26/4149.htm
- DOI: https://dx.doi.org/10.3748/wjg.v12.i26.4149


