Copyright
©2006 Baishideng Publishing Group Co.
World J Gastroenterol. Jul 7, 2006; 12(25): 3977-3982
Published online Jul 7, 2006. doi: 10.3748/wjg.v12.i25.3977
Published online Jul 7, 2006. doi: 10.3748/wjg.v12.i25.3977
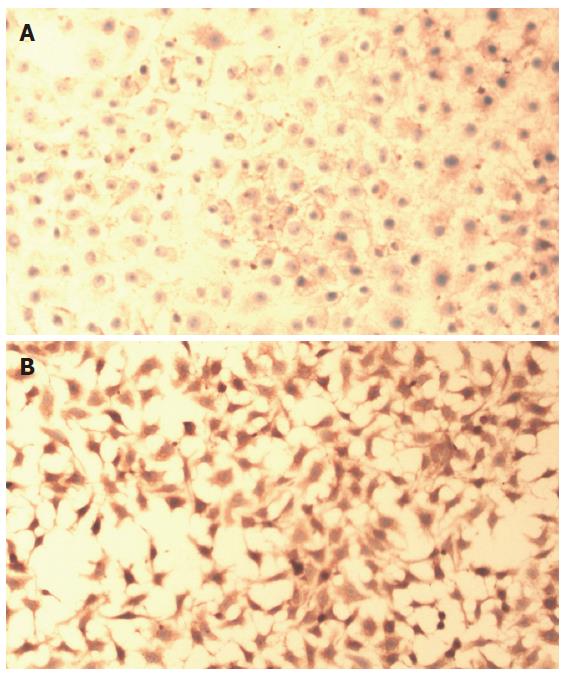
Figure 1 A: Immunohistochemical findings of IGF-IR in Chang liver cells.
Chang liver cells showing positive-staining of IGF-IR in the cell membranes of the cells (SABC, original magnification × 100); B: Immunohistochemical findings of IGF-IR in HepG2 cells. HepG2 cells showing stronger positive-staining of IGF-IR in the cell membranes of the cells than that of Chang liver cells (SABC, original magnification× 100).
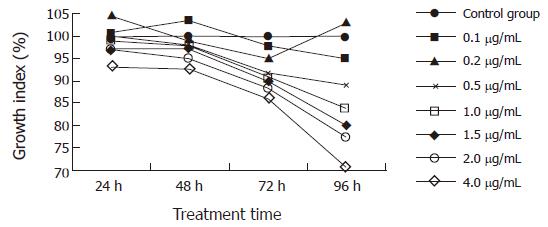
Figure 2 Effects of αIR3 on in vitro growth of HepG2 cells treated with various concentrations of αIR3 for different periods of time.
αIR3 of 0.1 μg/mL could stimulate HepG2 cells to proliferate, while αIR3 inhibited HepG2 cell proliferation in a dose- and time-dependent manner at a concentration ranging from 0.2 μg/mL to 4.0 μg/mL.
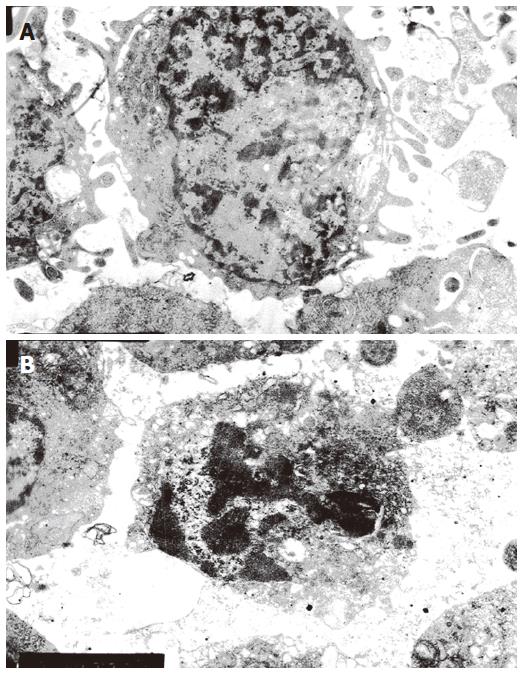
Figure 3 A: Transmission electron micrographs of HepG2 cells from the control group( EM , original magnification × 6200); B: Transmission electron micrographs of HepG2 cells from the αIR3 group (EM, original magnification × 6200).
- Citation: Zhang YC, Wang XP, Zhang LY, Song AL, Kou ZM, Li XS. Effect of blocking IGF-I receptor on growth of human hepatocellular carcinoma cells. World J Gastroenterol 2006; 12(25): 3977-3982
- URL: https://www.wjgnet.com/1007-9327/full/v12/i25/3977.htm
- DOI: https://dx.doi.org/10.3748/wjg.v12.i25.3977


