Copyright
©2006 Baishideng Publishing Group Co.
World J Gastroenterol. Jun 28, 2006; 12(24): 3924-3928
Published online Jun 28, 2006. doi: 10.3748/wjg.v12.i24.3924
Published online Jun 28, 2006. doi: 10.3748/wjg.v12.i24.3924
Figure 1 Effects of EGb on histology of CCL4-induced fibrotic rat liver.
Masson trichome staining, scale bar = 40 μm, original magnification × 100. A: Normal rat liver; B: Fibrosis in CCL4-treated group; C: Fibrosis in EGb-protected group.
Figure 2 Effects of EGb on type I collagen expression in CCl4-induced fibrotic rat liver.
Immunohistochemistry staining, scale bar = 40 μm, original magnification × 100. A: Normal rat liver; B: Strong expression of type I collagen in CCL4-treated group; C: Expression of type I collagen in EGb-protected group.
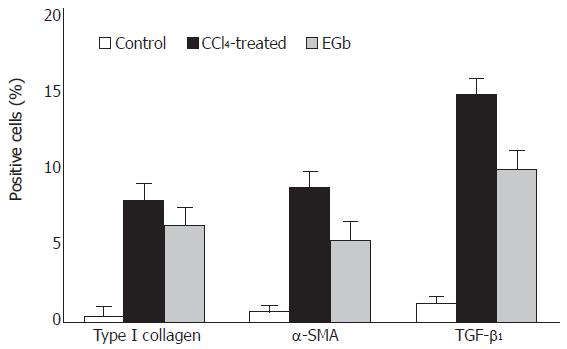
Figure 3 Percentage areas (%) of type I collagen, α-SMA, and TGF-β1 in rat liver.
- Citation: He SX, Luo JY, Wang YP, Wang YL, Fu H, Xu JL, Zhao G, Liu EQ. Effects of extract from Ginkgo biloba on carbon tetrachloride-induced liver injury in rats. World J Gastroenterol 2006; 12(24): 3924-3928
- URL: https://www.wjgnet.com/1007-9327/full/v12/i24/3924.htm
- DOI: https://dx.doi.org/10.3748/wjg.v12.i24.3924


