Copyright
©2006 Baishideng Publishing Group Co.
World J Gastroenterol. Jun 28, 2006; 12(24): 3841-3847
Published online Jun 28, 2006. doi: 10.3748/wjg.v12.i24.3841
Published online Jun 28, 2006. doi: 10.3748/wjg.v12.i24.3841
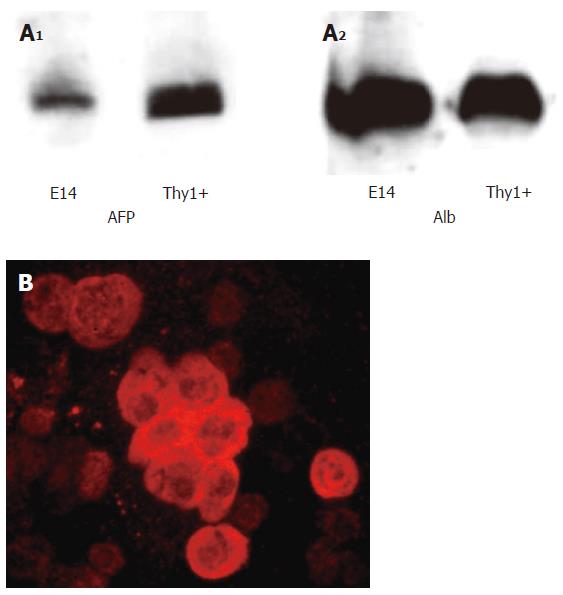
Figure 1 Western blot showing albumin and AFP expression in E14 livers and Thy1 selected cells from rat E14 fetal livers (A) and albumin staining on cytospins of Thy1 selected cells from E14 livers (B).
Figure 2 Expression of various oval cell markers, liver-enriched transcription factors and hepatic or bile duct specific markers in Thy1 positive and Thy negative cells from rat E14 fetal livers (RT-PCR).
Figure 3 Morphology of colonies of Thy1-selected cells cultured for 1 wk on STO growth- arrested feeder layers.
(A) X 25; (B) X 100.
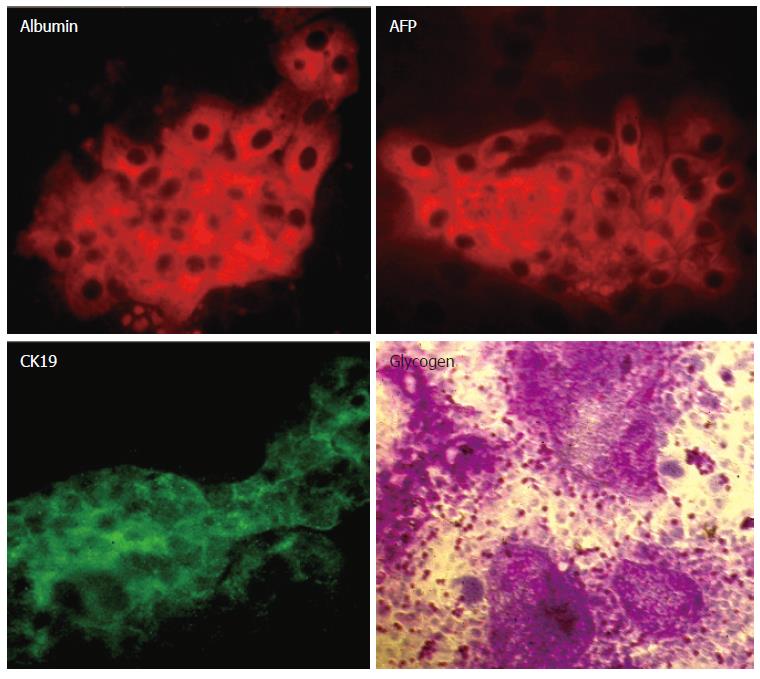
Figure 4 Colonies of Thy1-selected cells cultured for 2 wk on STO growth- arrested -feeder layers and stained with antibodies to albumin, AFP and CK18, and with a PAS detection kit for glycogen.
The experiments were repeated three times had similar results.
Figure 5 Hepatic and biliary epithelial markers in Thy1 positive selected cells cultured for 2 wk on STO growth- arrested feeder layers (RT-PCR).
- Citation: Isabel Z, Miri B, Einav H, Ella BL, Zamir H, Ran O. Isolation, characterization and culture of Thy1-positive cells from fetal rat livers. World J Gastroenterol 2006; 12(24): 3841-3847
- URL: https://www.wjgnet.com/1007-9327/full/v12/i24/3841.htm
- DOI: https://dx.doi.org/10.3748/wjg.v12.i24.3841


