Copyright
©2006 Baishideng Publishing Group Co.
World J Gastroenterol. Jun 28, 2006; 12(24): 3821-3828
Published online Jun 28, 2006. doi: 10.3748/wjg.v12.i24.3821
Published online Jun 28, 2006. doi: 10.3748/wjg.v12.i24.3821
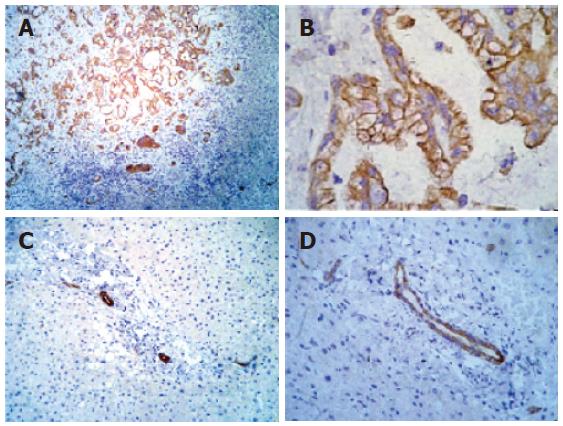
Figure 1 Immunohistochemical analysis of IGF-IR in liver tissue.
A: Positive control cholangiocarcinoma tissue showing strongly positive staining for IGF-IR in neoplastic ducts (-100 ×); B: positive control cholangiocarcinoma tissue showing strongly positive staining for IGF-IR in neoplastic ducts (-200 ×); C: normal liver tissue showing IGF-IR immunoreactivity in ductal cells (-100 ×); D: normal liver tissue showing IGF-IR immunoreactivity in ductal cells (-200 ×).
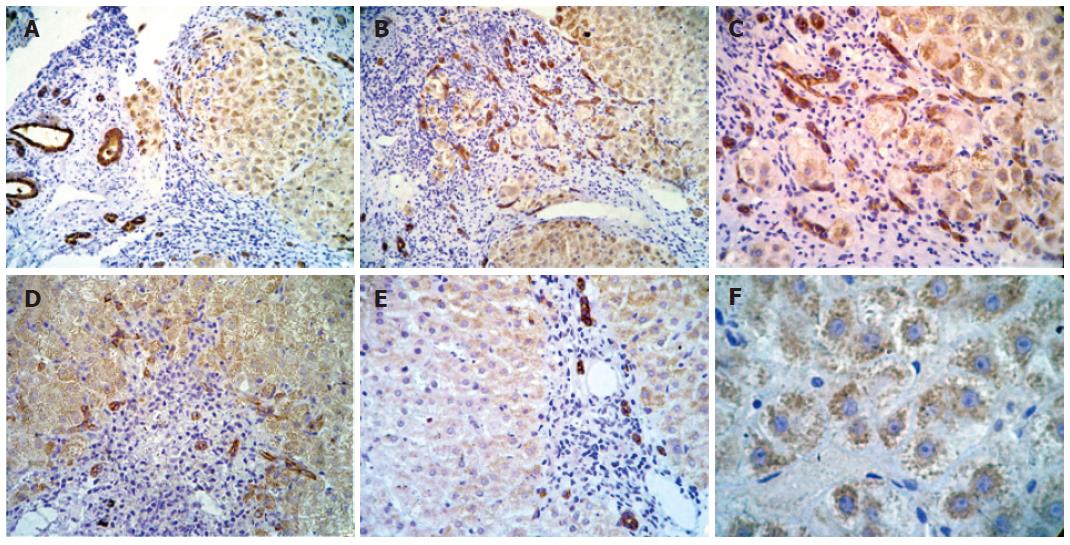
Figure 2 Immunohistochemical analysis of IGF-IR in different samples of liver.
A: Strong positive staining in cytoplasm of hepatocytes in all acinar zones (-100 ×); B: strong positive staining in cytoplasmic membrane and cytoplasm of proliferate bile ducts and in cytoplasm of hepatocytes located in all acinar zones (-100 ×); C: strong positive staining in cytoplasmic membrane and cytoplasm of proliferate bile ducts and in cytoplasm of hepatocytes located in all lobular regions (-200 ×); D: strong positive staining in cytoplasmic membrane and cytoplasm of proliferate bile ducts and in cytoplasm of hepatocytes located in all acinar zones (-100 ×); E: strong positive staining in periportal duct cells (-100x); and F: granular pattern of positivity in cytoplasm of hepatocytes in all lobular regions (-400 ×).
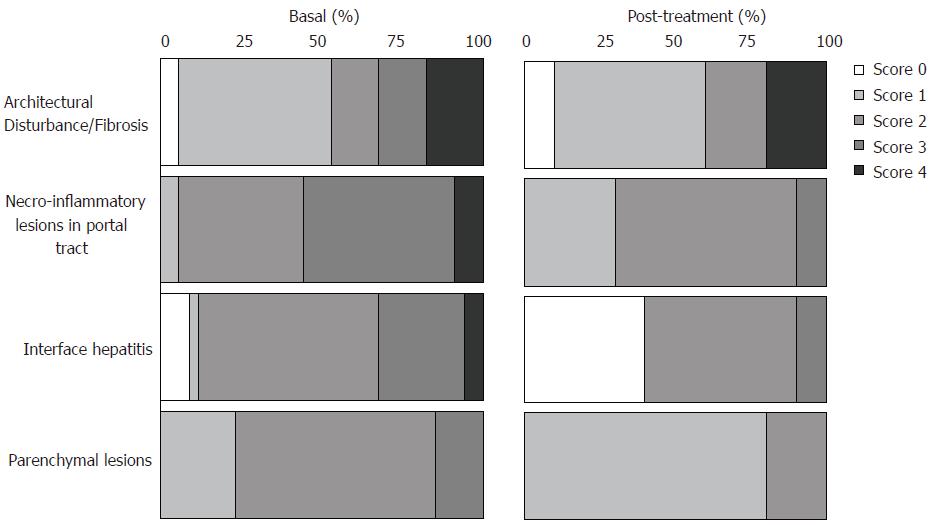
Figure 3 Percentage of score distribution obtained by histological analyses in liver biopsies from pre- (34 cases) and post-treatment (10 cases, 5 sustained virological responders and 5 non-responders) according to Brazilian Consensus on Chronic Hepatitis[21].
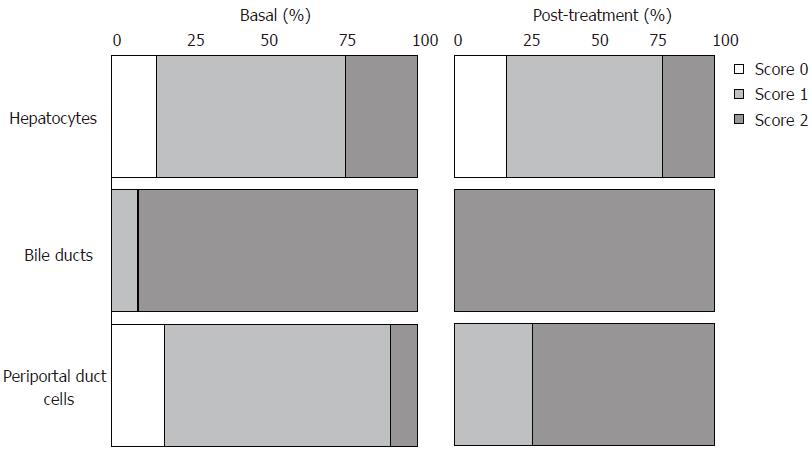
Figure 4 Percentage of score distribution obtained by IGF-IR immunohistochemical analyses in liver biopsies from pre- (34 cases) and post-treatment (10 cases, 5 sustained virological responders and 5 non-responders).
Figure 5 Semi-quantitative RT-PCR analysis of IGF-IR mRNA in hepatic fragments obtained from 2 patients with chronic hepatitis C (lanes 1 and 2) and normal human liver (NL).
The experiments for the patients with CHC were carried out in triplicates and for normal human liver (NL) in duplicates. Human placenta was used as a positive control (PC) and no DNA template as negative control (NC).
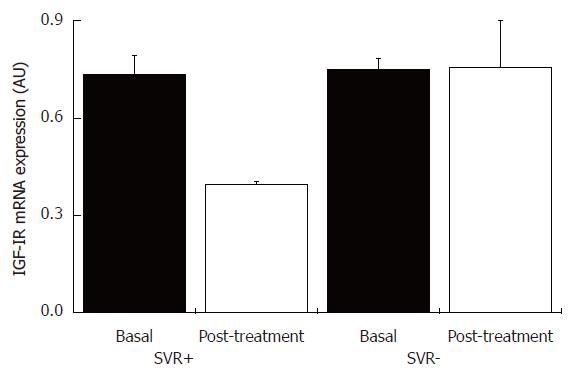
Figure 6 IGF-IR mRNA content in liver tissue from patients with chronic hepatitis C with and without sustained virological response, and pre- and post-treatment with INF-α and ribavirin.
SVR+: With sustained virological response (n = 5); SVR-: without sustained virological response (n = 5).
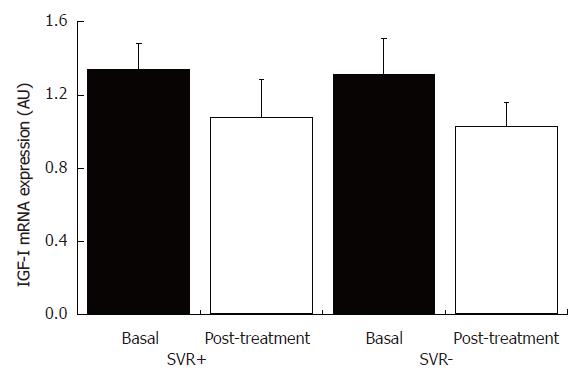
Figure 7 IGF-I mRNA content in liver tissue from patients with chronic hepatitis C with and without sustained virological response, and pre- and post-treatment with INF-α and ribavirin.
SVR+: With sustained virological response (n = 5); SVR-: without sustained virological response (n = 5).
Figure 8 Preservation-reperfusion injury: Representative results of semi- quantitative RT-PCR analysis of IGF-IR mRNA in 2 hepatic fragments from cadaveric liver donor following orthopic transplantation (lanes 1 and 2).
The experiment was carried out in triplicates. Human placenta was used as a positive control (PC) and no DNA template as negative control (NC).
- Citation: Stefano JT, Corrêa-Giannella ML, Ribeiro CMF, Alves VAF, Massarollo PCB, Machado MCC, Giannella-Neto D. Increased hepatic expression of insulin-like growth factor-I receptor in chronic hepatitis C. World J Gastroenterol 2006; 12(24): 3821-3828
- URL: https://www.wjgnet.com/1007-9327/full/v12/i24/3821.htm
- DOI: https://dx.doi.org/10.3748/wjg.v12.i24.3821


