Copyright
©2006 Baishideng Publishing Group Co.
World J Gastroenterol. Jun 28, 2006; 12(24): 3803-3809
Published online Jun 28, 2006. doi: 10.3748/wjg.v12.i24.3803
Published online Jun 28, 2006. doi: 10.3748/wjg.v12.i24.3803
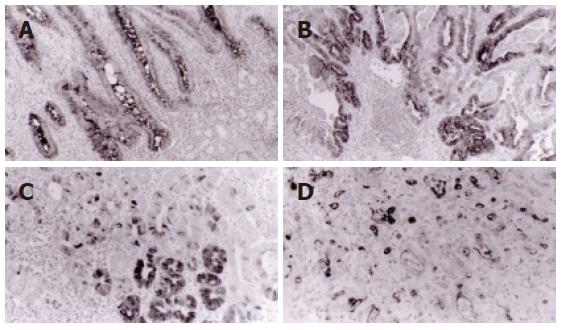
Figure 1 Immunohistochemical analysis of tumor differentiation phenotype in gastric tumor.
A: Human gastric mucin (HGM) (45M1, × 200); B: MUC6 (CLH5, × 100); C: MUC2 (Ccp58, × 200); D: CD10 (56C6, × 200).
Figure 2 Classification of tumor differentiation phenotype.
The phenotypes were classified into three groups (gastric-phenotype, intestinal-phenotype, gastric and intestinal mixed-phenotype) according to the combination of the expression of human gastric mucin (HGM), MUC6, MUC2 and CD10.
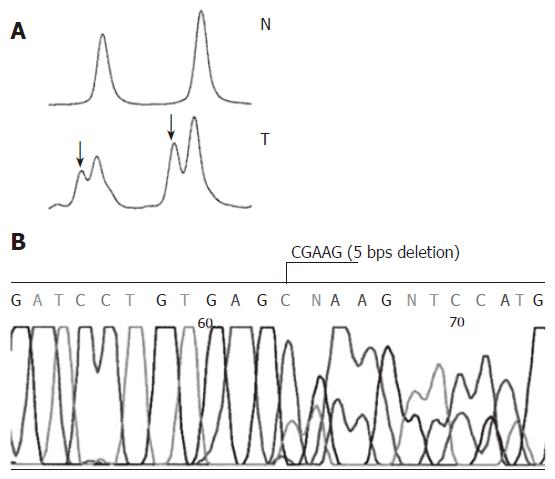
Figure 3 Mutation analysis of the APC gene in gastric tumour.
A: PCR-single-strand conformation polymorphism (PCR-SSCP) analysis shows shift peak (arrowhead) as compared with the control normal DNA; B: DNA sequence analysis reveals frameshift mutation (CGAAG, 5 bps deletion) at codons 1321 of the APC gene. T: Tumor DNA, N: Normal DNA.
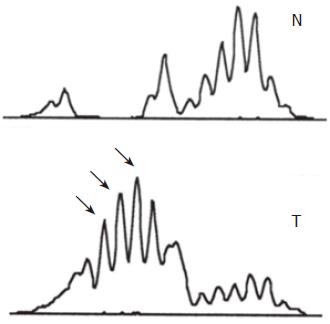
Figure 4 Microsatellite instability (MSI) using marker BAT-26 shows a different allelic shift peak (arrowhead) as compared with the control normal DNA.
T: Tumor DNA, N: Normal DNA.
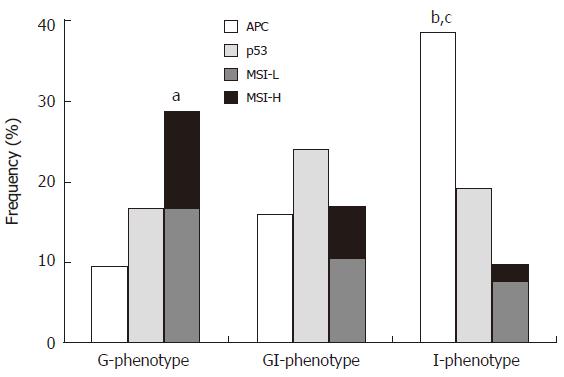
Figure 5 Frequency of APC, p53 mutation and MSI in gastric- (G-), gastric and intestinal mixed- (GI-), and intestinal- (I-) phenotype tumors.
aP = 0.0353 (G-phenotype vs I-phenotype, 28.6% vs 9.6%), bP = 0.0017 (I-phenotype vs G- phenotype, 38.5% vs 9.5%), cP = 0.0022 (I-phenotype vs GI-phenotype, 38.5% vs 16.0%).
- Citation: Yamazaki K, Tajima Y, Makino R, Nishino N, Aoki S, Kato M, Sakamoto M, Morohara K, Kaetsu T, Kusano M. Tumor differentiation phenotype in gastric differentiated-type tumors and its relation to tumor invasion and genetic alterations. World J Gastroenterol 2006; 12(24): 3803-3809
- URL: https://www.wjgnet.com/1007-9327/full/v12/i24/3803.htm
- DOI: https://dx.doi.org/10.3748/wjg.v12.i24.3803


