Copyright
©2006 Baishideng Publishing Group Co.
World J Gastroenterol. Jun 21, 2006; 12(23): 3716-3721
Published online Jun 21, 2006. doi: 10.3748/wjg.v12.i23.3716
Published online Jun 21, 2006. doi: 10.3748/wjg.v12.i23.3716
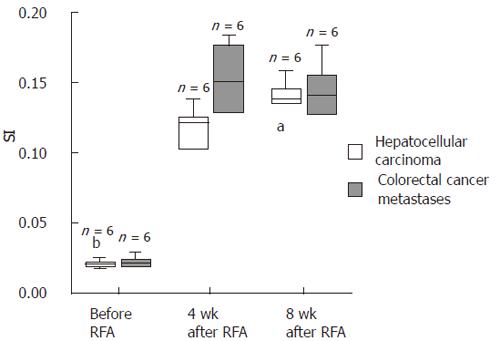
Figure 1 Stimulation indices of CD8+ T cells.
The Box-Whisker-plots show the ratio of IFNγ secretion of stimulated vs unstimulated CD8+ T cells as determined by a cytokine secretion and capture assay before, 4 and 8 wk after RFA. White boxes represent the patients with HCC and grey boxes the patients with colorectal cancer metastases. Outlayers are marked with "a", extremes with "b". For significances refer to table 1.
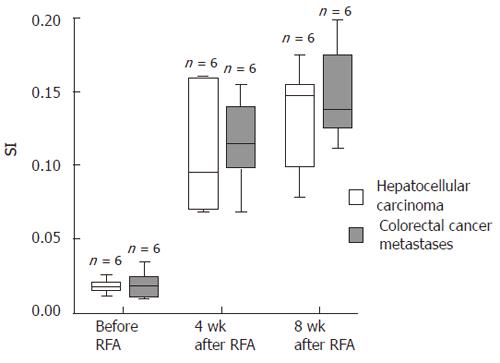
Figure 2 Stimulation indices of CD4+ T cells.
The Box-Whisker-plots show the ratio of IFNγ secretion of stimulated vs unstimulated CD4+ T cells as determined by a cytokine secretion and capture assay before, 4 and 8 wk after RFA. White boxes represent the patients with HCC and grey boxes the patients with colorectal cancer metastases. Outlayers are marked with o, extremes with *. For significances refer to table 1.
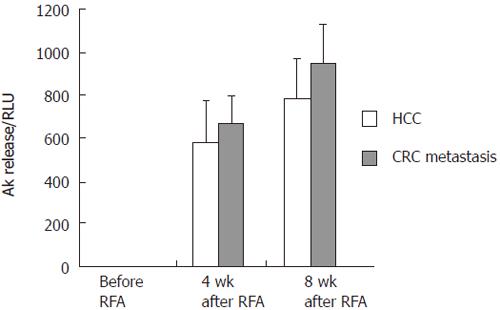
Figure 3 Adenylate kinase (AK) release of cultured tumor cells.
Release of adenylate kinase (AK) from the human hepatoma cell line HepG2 and the hman colorectal carcinoma cell line CaCo co-incubated with PBMC isolated before, 4 and 8 wk after RFA. The release of AK correlates with the cytotoxic and NK T cell mediated damage to the cultured cells. HepG2 cells were used for PBMC from the patients with HCC and CaCo cells for the patients with metastasis of colorectal carcinoma.
- Citation: Hänsler J, Wissniowski TT, Schuppan D, Witte A, Bernatik T, Hahn EG, Strobel D. Activation and dramatically increased cytolytic activity of tumor specific T lymphocytes after radio-frequency ablation in patients with hepatocellular carcinoma and colorectal liver metastases. World J Gastroenterol 2006; 12(23): 3716-3721
- URL: https://www.wjgnet.com/1007-9327/full/v12/i23/3716.htm
- DOI: https://dx.doi.org/10.3748/wjg.v12.i23.3716


