Copyright
©2006 Baishideng Publishing Group Co.
World J Gastroenterol. May 21, 2006; 12(19): 3088-3091
Published online May 21, 2006. doi: 10.3748/wjg.v12.i19.3088
Published online May 21, 2006. doi: 10.3748/wjg.v12.i19.3088
Figure 1 Distribution of intragastric hydrogen levels in all 473 subjects.
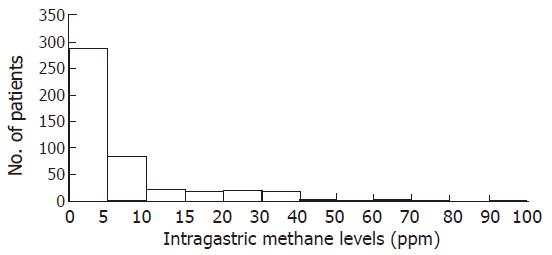
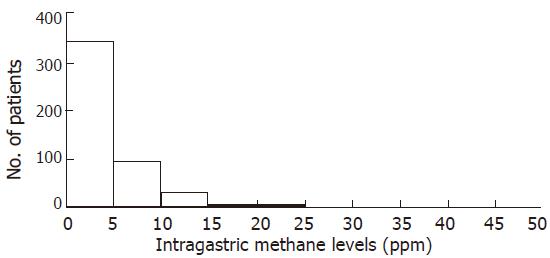
Figure 2 Distribution of intragastric methane levels in all 473 subjects.
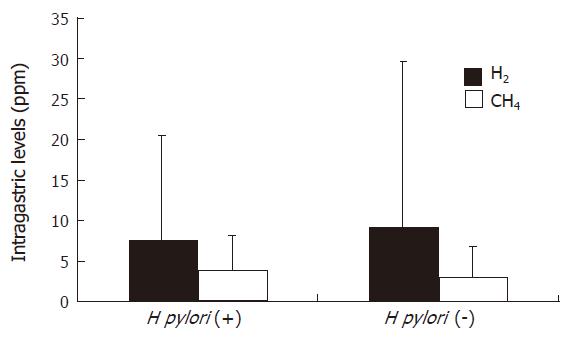
Figure 3 Intragastric hydrogen and methane levels in relation to H pylori status.
- Citation: Urita Y, Ishihara S, Akimoto T, Kato H, Hara N, Honda Y, Nagai Y, Nakanishi K, Shimada N, Sugimoto M, Miki K. Hydrogen and methane gases are frequently detected in the stomach. World J Gastroenterol 2006; 12(19): 3088-3091
- URL: https://www.wjgnet.com/1007-9327/full/v12/i19/3088.htm
- DOI: https://dx.doi.org/10.3748/wjg.v12.i19.3088


