Copyright
©2006 Baishideng Publishing Group Co.
World J Gastroenterol. May 14, 2006; 12(18): 2914-2918
Published online May 14, 2006. doi: 10.3748/wjg.v12.i18.2914
Published online May 14, 2006. doi: 10.3748/wjg.v12.i18.2914
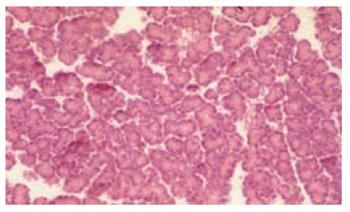
Figure 1 Light microscopy (display alternation = 200) of pacreatic tissue 6 h after induction of acute pancreatitis and traement with HBOC (score: 6 points out of 16).
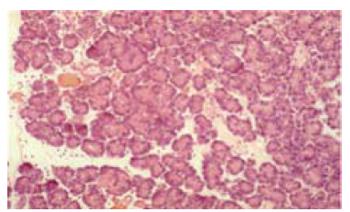
Figure 2 Light microscopy (display alternation = 200) of pacreatic tissue 6 h after induction of acute pancreatitis and traement with HES (score: 8.
5 points out of 16).
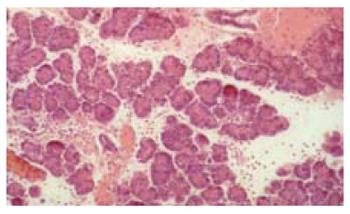
Figure 3 Light microscopy (display alternation = 200) of pacreatic tissue 6 h after induction of acute pancreatitis and treatment with NaCl (score: 10 points out of 16).
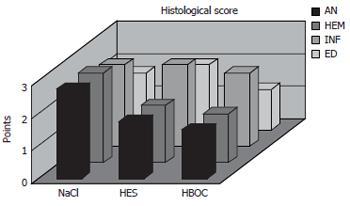
Figure 4 Histological scoring of pancreatic tissue 6 h after induction of acute pancreatitis.
Values are mean ± range. (AN = acinar necrosis, HEM = hemorrhage, INF = leucocyte infiltration, ED = edema).
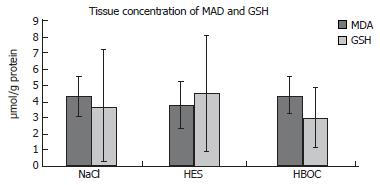
Figure 5 Tissue concentration of MDA and GSH in pancreatic tissue 6 h after induction of acute pancreatitis.
Values are mean ± SD.
- Citation: Kleinhans H, Mann O, Schurr PG, Kaifi JT, Hansen B, Izbicki JR, Strate T. Oxygen radical formation does not have an impact in the treatment of severe acute experimental pancreatitis using free cellular hemoglobin. World J Gastroenterol 2006; 12(18): 2914-2918
- URL: https://www.wjgnet.com/1007-9327/full/v12/i18/2914.htm
- DOI: https://dx.doi.org/10.3748/wjg.v12.i18.2914


