Copyright
©2006 Baishideng Publishing Group Co.
World J Gastroenterol. May 14, 2006; 12(18): 2870-2875
Published online May 14, 2006. doi: 10.3748/wjg.v12.i18.2870
Published online May 14, 2006. doi: 10.3748/wjg.v12.i18.2870
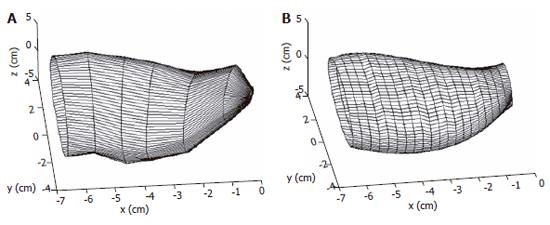
Figure 1 A 3-D sigmoid colon solid model (A), the surface model based on the cross sectional images (B)and the 3-D surface model with slices along the centre axis (C).
Figure 2 A 3-D reconstructed stomach antrum wall surface before (A) and after (B) surface smoothing by using the Fourier transform method.
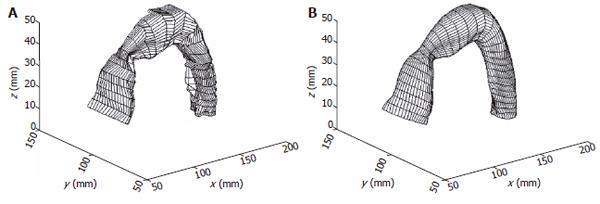
Figure 3 A 3-D sigmoid colon segment surface before (A) and after (B) surface smoothing by using the non-shrinking Gaussian method.
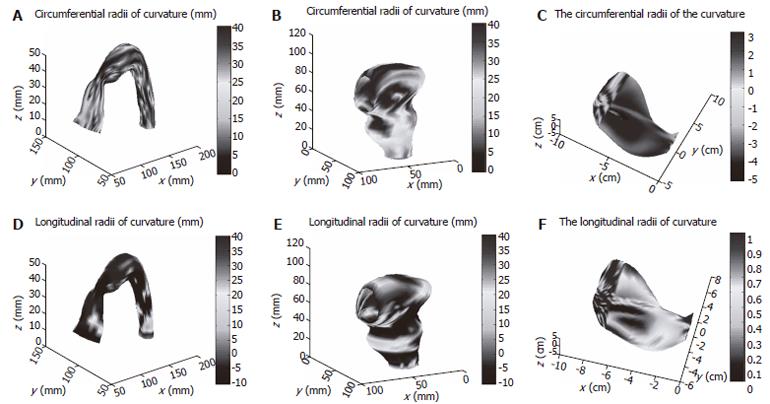
Figure 4 Circumferential (A, B, C) and longitudinal (D, E, F) radii of curvatures distributions in sigmoid colon (A, D), rectum (B, E) and human stomach (C, F).
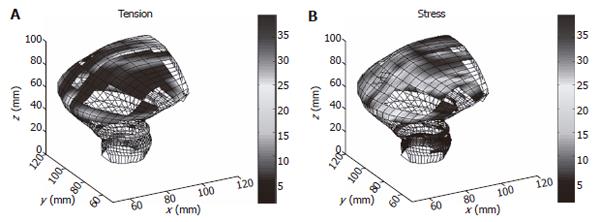
Figure 5 Tension (A) and stress (B) distribution on a distended rectum model.
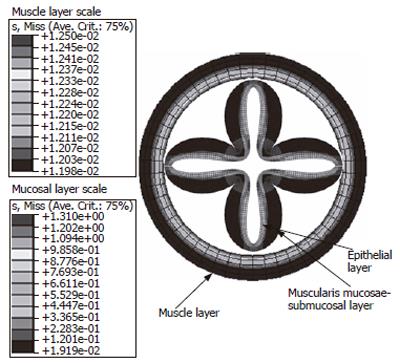
Figure 6 Mises stress (left) distribution in the mucosal folded three-layered esophagus at the bonded state.
Math 1 Math(A1).
Math 2 Math(A4).
- Citation: Liao D, Frøkjær JB, Yang J, Zhao J, Drewes AM, Gilja OH, Gregersen H. Three-dimensional surface model analysis in the gastrointestinal tract. World J Gastroenterol 2006; 12(18): 2870-2875
- URL: https://www.wjgnet.com/1007-9327/full/v12/i18/2870.htm
- DOI: https://dx.doi.org/10.3748/wjg.v12.i18.2870


