Copyright
©2006 Baishideng Publishing Group Co.
World J Gastroenterol. Apr 21, 2006; 12(15): 2388-2393
Published online Apr 21, 2006. doi: 10.3748/wjg.v12.i15.2388
Published online Apr 21, 2006. doi: 10.3748/wjg.v12.i15.2388
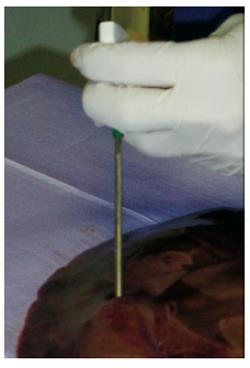
Figure 1 A 7-gauge biopsy needle and a syringe were used for insertion of the gelatine/FDG mixture into the liver.
The mixture hardened as it cooled in the ex-vivo-liver.
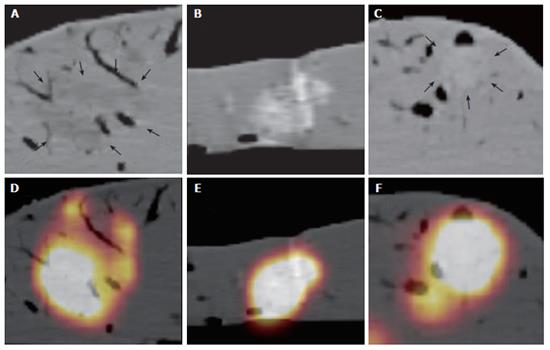
Figure 2 A: This shows a hypodense lesion.
The margins of the hypodense lesion are barely seen (fine black arrows). In comparison, the combined PET/CT image of the same lesion shows exactly the margins of the lesion (Figure 2D). Furthermore, the combined PET/CT suggests a different location and extent of the lesion, which was confirmed by the standard of reference. B: This shows a hyperdense lesion. The margins of the lesions are well seen. The combined PET/CT shows the same location and extent of the lesion within the liver tissue (Figure 2E). Thus, in hyperdense lesions, a high correlation of CT and combined PET/CT measurements was found. C: This shows a nearly isodense lesion. The margins of the lesions can only be anticipated (fine black arrows). The corresponding PET/CT (Figure 2 F) of the same lesion shows a different extent of the same lesion with well defined and sharp margins.
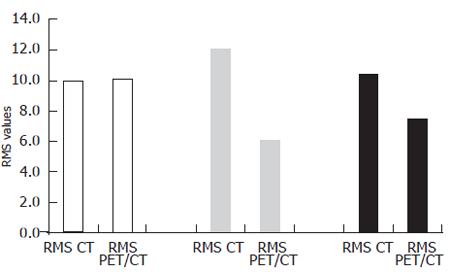
Figure 3 This shows the different mean RMS values for hyper-, iso-, and hypodens lesions.
A statistically significant difference was found between the mean RMS values in CT and PET/CT in isodense lesions (P < 0.05, grey bars). Additionally, a statistically significant difference was found between the mean RMS values of CT and PET/CT in hypodense lesions (P < 0.05, black bars). No difference was found in hyperdense lesions (white bars).
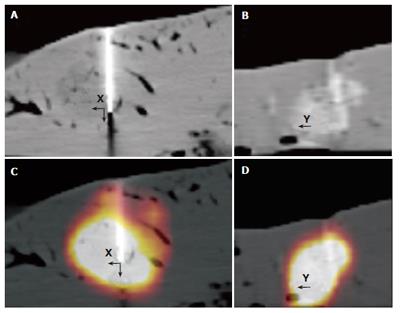
Figure 4 It shows the measurements on the commercially available computer workstation for CT alone (A/B) and combined PET/CT (C/D).
The lesions´ width and height was measured in coronal direction (Figure 4A and C, X/Z), the lesions´ length in sagittal direction (black arrow (Y) in Figure 4 B and D).
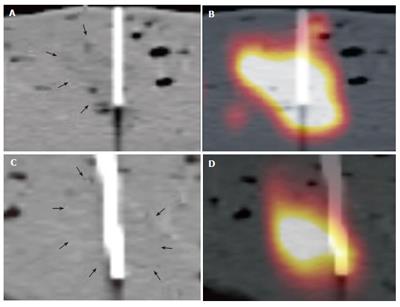
Figure 5 It shows an example of two isodense lesions on CT alone and combined PET/CT with the inserted biopsy needles.
The lesions margins are barely seen on CT images alone (fine black arrows, A and C). In comparison, the true extent and localisation of the lesion are well shown on the combined PET/CT images. Based on poor visibility on CT alone, the lesion in the bottom row was nearly missed (D).
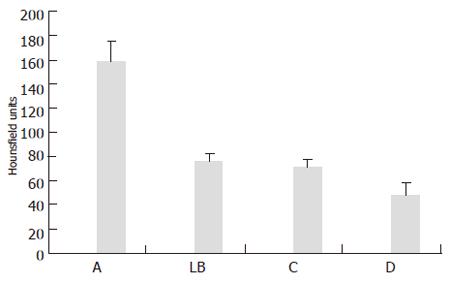
Figure 6 This shows the mean Hounsfield Units (HU) of all measured lesion types, the compared liver background and the corresponding standard deviation.
A: hyperdense lesions; LB: liver background; C: isodense lesions; D: hypodense lesions.
- Citation: Veit P, Kuehle C, Beyer T, Kuehl H, Bockisch A, Antoch G. Accuracy of combined PET/CT in image-guided interventions of liver lesions: An ex-vivo study. World J Gastroenterol 2006; 12(15): 2388-2393
- URL: https://www.wjgnet.com/1007-9327/full/v12/i15/2388.htm
- DOI: https://dx.doi.org/10.3748/wjg.v12.i15.2388


