Copyright
©2006 Baishideng Publishing Group Co.
World J Gastroenterol. Mar 28, 2006; 12(12): 1905-1911
Published online Mar 28, 2006. doi: 10.3748/wjg.v12.i12.1905
Published online Mar 28, 2006. doi: 10.3748/wjg.v12.i12.1905
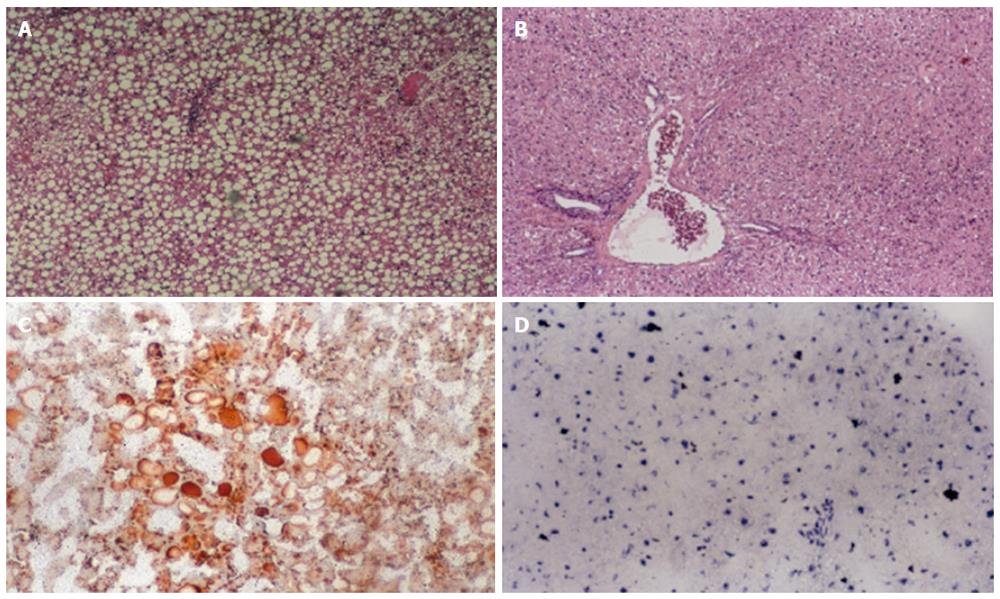
Figure 1 Histological features of liver tissue of rats fed with choline-deficient diet.
A: Control group showing a moderate macro and microvacuolar steatosis in periportal zone; B: SNAC-treated animals showing normal liver in periportal zone (hematoxylin-eosin stain-HE); C: Control group showing positive Scharlach staining; D: SNAC-treated animals showing negative Scharlach staining.
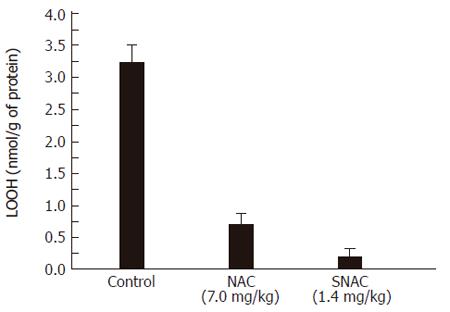
Figure 2 Concentration of hydroperoxides (LOOH) in liver homogenates of the control group, NAC and SNAC-treated animals.
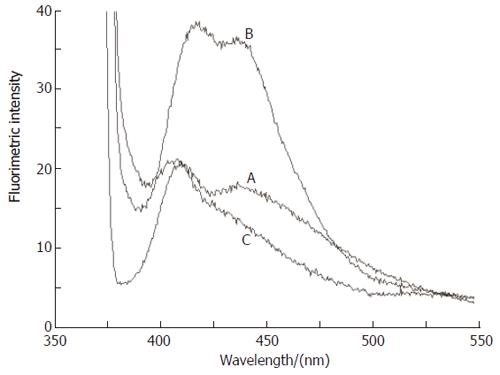
Figure 3 Emission spectra of human LDL (200 μg/mL) suspended in aerated PBS.
A: Freshly prepared suspension; B: after incubation with CuCl2 (300 μmol/L) for 15 h; C: after co-incubation with CuCl2 (300 μmol/L) and SNAC (300 μmol/L). The excitation and emission wavelengths were 360 and 433 nm, respectively.
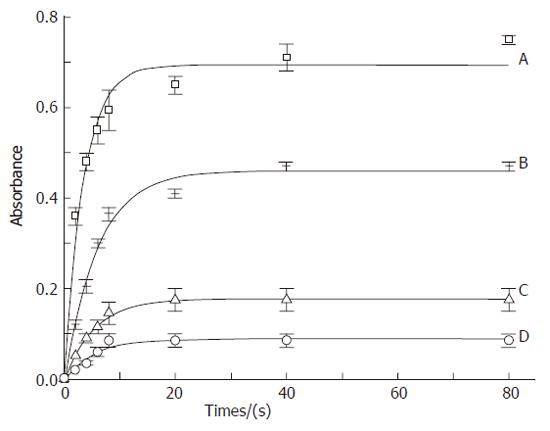
Figure 4 Kinetic curves of linoleic acid (18.
76 μmol/L) peroxidation catalyzed by SLO (A) (0.056 μmol/L), SLO co-incubated with NAC (B) (560 μmol/L), SLO co-incubated with SNAC (C) (56 μmol/L) and SLO co-incubated with SNAC (D) (560 μmol/L). Absorbance changes were monitored at 234 nm at 37 °C.
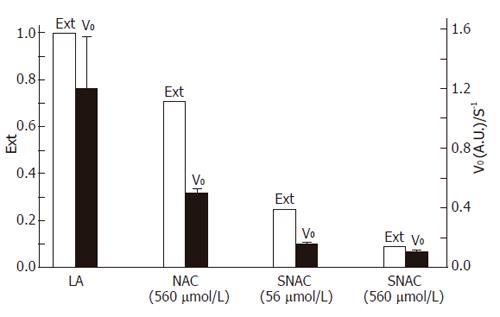
Figure 5 Barr graph showing the extent (Ext) and initial rates (V0) of the peroxidation reaction of linoleic acid (LA) by SLO.
Data were extracted from the curves of Figure 4.
- Citation: Oliveira CP, Simplicio FI, Lima VM, Yuahasi K, Lopasso FP, Alves VA, Abdalla DS, Carrilho FJ, Laurindo FR, Oliveira MG. Oral administration of S-nitroso-N-acetylcysteine prevents the onset of non alcoholic fatty liver disease in rats. World J Gastroenterol 2006; 12(12): 1905-1911
- URL: https://www.wjgnet.com/1007-9327/full/v12/i12/1905.htm
- DOI: https://dx.doi.org/10.3748/wjg.v12.i12.1905


