Copyright
©2006 Baishideng Publishing Group Co.
World J Gastroenterol. Mar 28, 2006; 12(12): 1895-1904
Published online Mar 28, 2006. doi: 10.3748/wjg.v12.i12.1895
Published online Mar 28, 2006. doi: 10.3748/wjg.v12.i12.1895
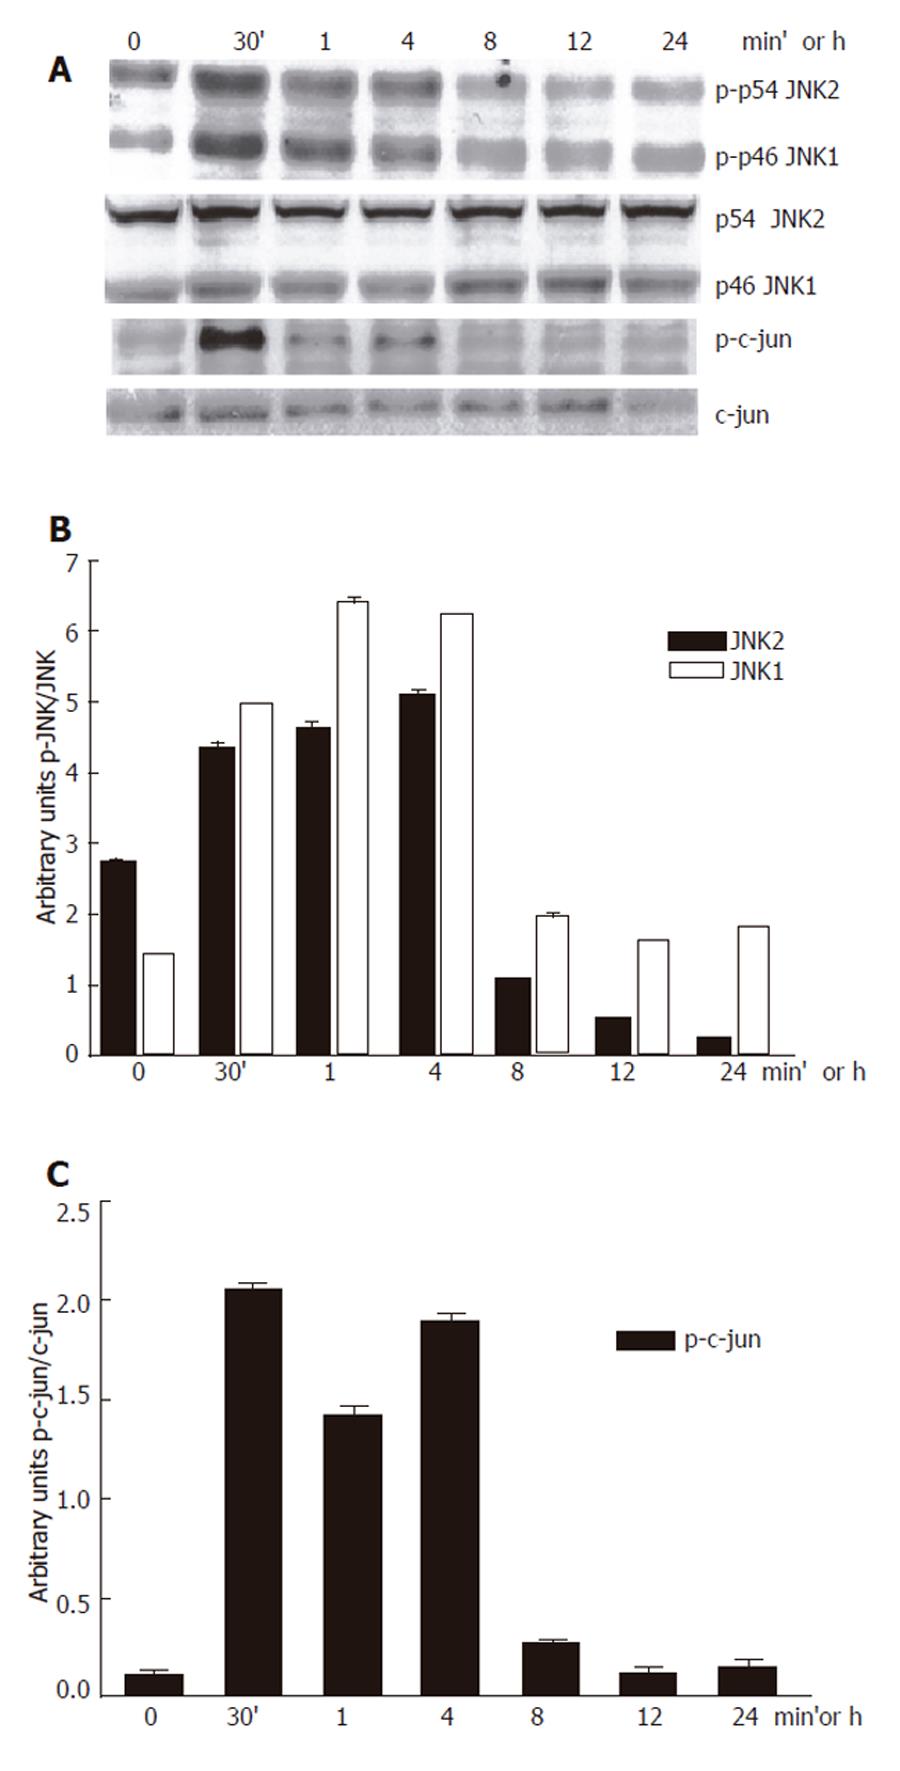
Figure 1 Inhibition of 100 mmol/L ethanol-induced JNK activation by SP600125.
A: Western blot; B: JNK; C: P-c-jun densitometric analysis.
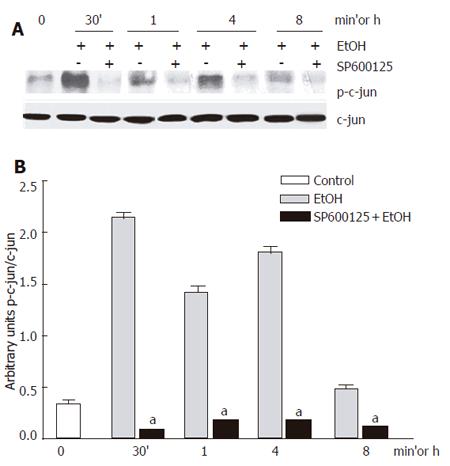
Figure 2 c-jun phosphorylation inhibition by 100 µmol/L SP600125.
A: Western blot; B: Densitometric analysis. Each bar represents mean±SEM of n = 3. aindicates a significant difference (P < 0.05) between c-jun phosphorylation in hepatocytes exposed to ethanol only and SP600125-pretreated hepatocytes.
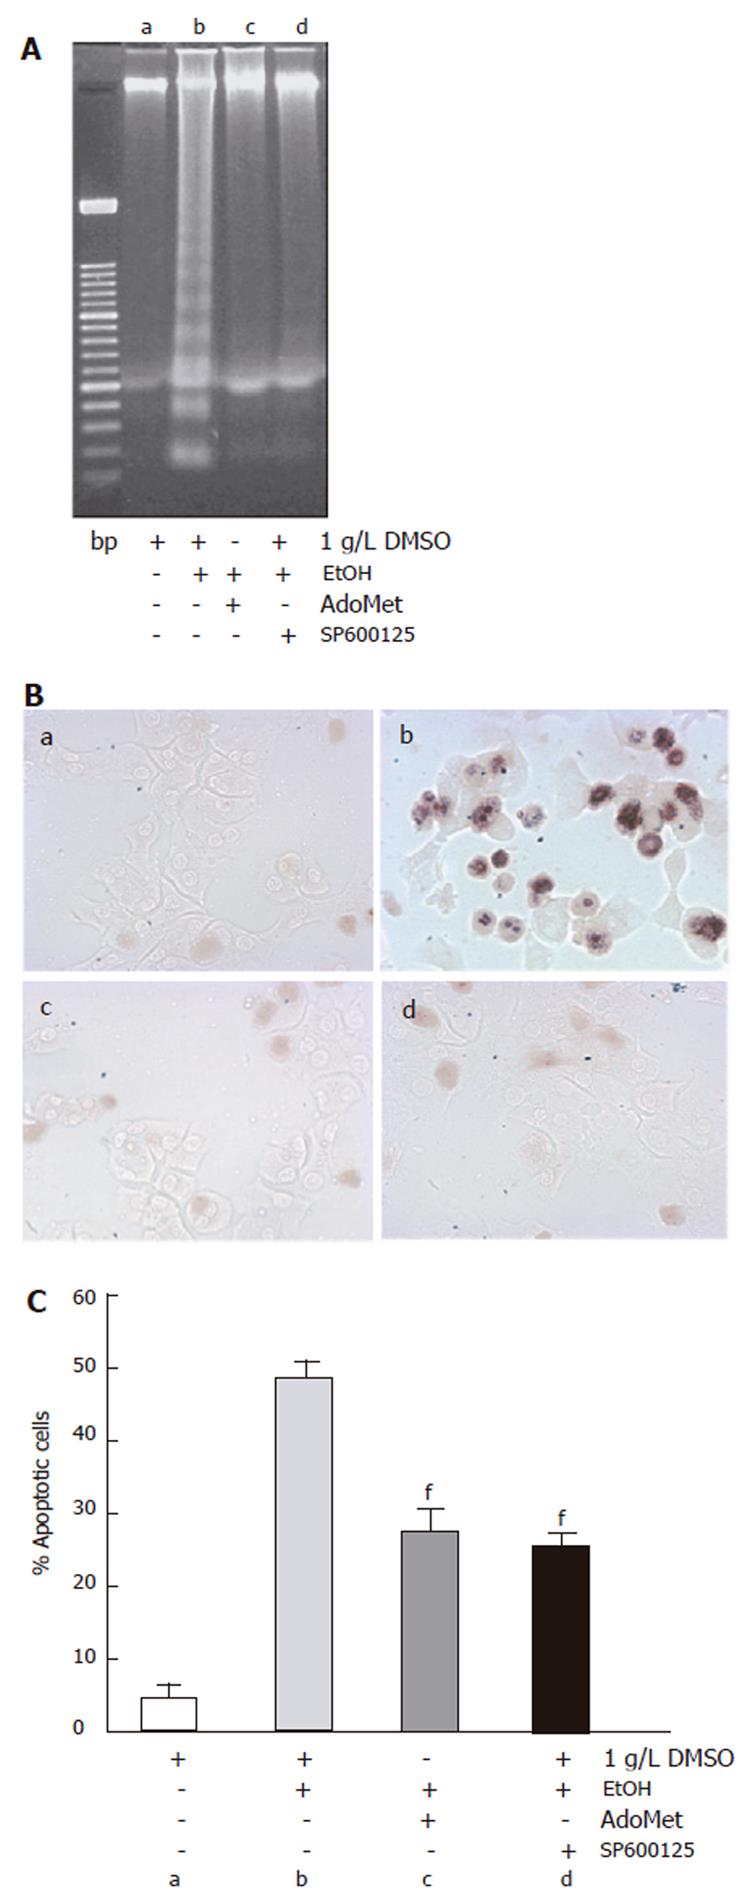
Figure 3 Effect of SP600125 and AdoMet in apoptosis induced by ethanol.
A: DNA ladder assay; B: 40x TUNEL assay; C: data from TUNEL assay; a: control; b: ethanol; c: AdoMet+ ethanol; d: SP600125 + ethanol. The data represent mean±SE of n = 3. findicates a significant difference (P < 0.05) between SP600125 or AdoMet-pretreated cells and cells only pretreated with DMSO and exposed to ethanol.
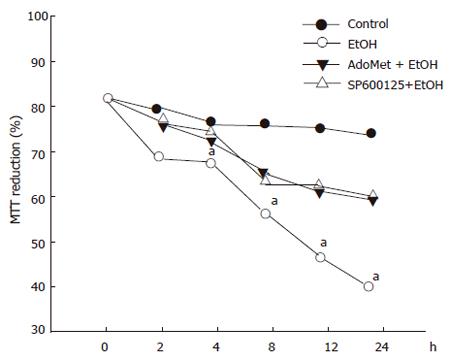
Figure 4 Protective effect of SP600125 and AdoMet on ethanol hepatocyte injury.
Data represent percentage of MTT reduction in mean±SEM of n = 3. arepresents a significant difference (P < 0.05) in MTT reduction between pretreated and non-pretreated cells.
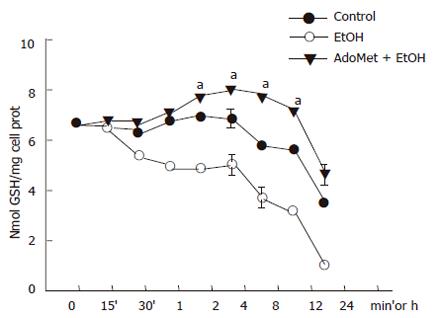
Figure 5 Prevention of GSH decrease in hepatocyte cultures exposed to ethanol by AdoMet.
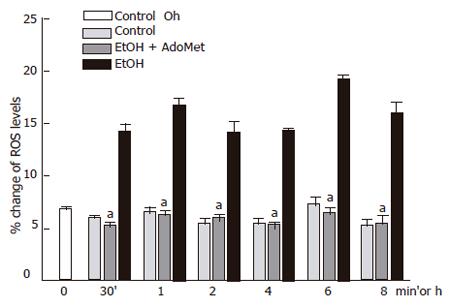
Data represent percentage change of ROS levels in mean±SEM of n = 3. arepresents a significant difference (P < 0.05) in ROS generation between pretreated cells and cells exposed to ethanol only.
Figure 6 Decrease of ethanol-induced ROS generation in hepatocyte cultures by AdoMet.
ROS generation in hepatocytes pretreated with Ado Met and ethanol was significantly reduced compared to hepatocyte cultures exposed to ethanol only (aP < 0.05).
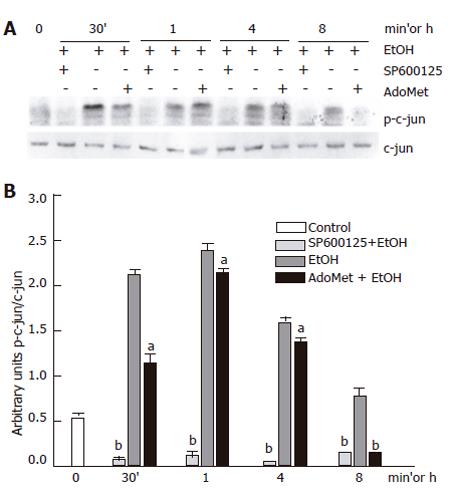
Figure 7 Effect of AdoMet on JNK activity.
A: Western blot; B: densitometric analysis. Data represent mean±SEM of n = 3. (aP < 0.05) or (bP < 0.01) indicates a significant difference in c-jun phosphorylation between SP600125- or AdoMet-pretreated cells and non-pretreated cells exposed to ethanol.
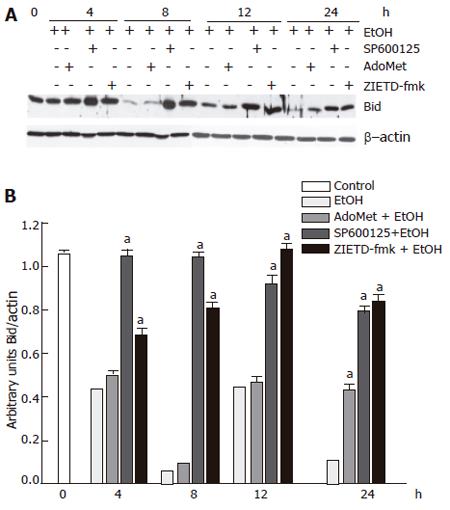
Figure 8 Preventive effect of SP600125 and AdoMet on Bid cleavage, a component of the JNK signaling pathway.
A: Western blot; B: densitometric analysis. The data represent mean± SE for n = 3. a indicates a significant difference in Bid fragmentation between SP600125- or Z-IETD-fmk-pretreated cells and cells exposed to ethanol only (P < 0.05).
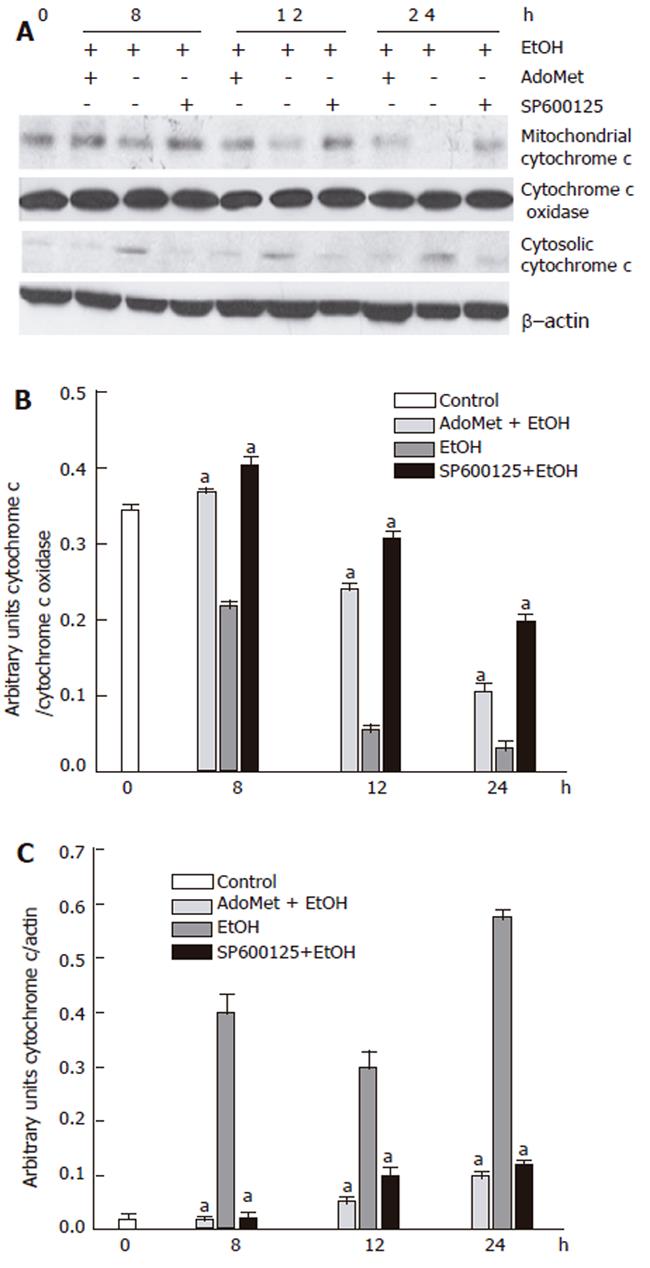
Figure 9 Prevention of cytochrome c release by AdoMet and SP600125.
A: Western blot; B: mitochondrial cytochrome c; C: cytosolic cytochrome c densitometric analysis. arepresents a significant decrease (P < 0.05) in cytochrome c release in AdoMet- and SP600125-pretreated hepatocytes in comparison with non-pretreated cells.
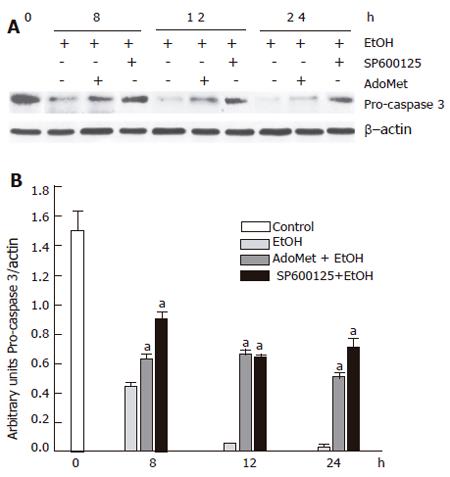
Figure 10 Decrease of ethanol-induced pro-caspase 3 fragmentation by SP600125 and AdoMet.
A: Western blot; B: densitometric analysis. aindicates a significant difference (P < 0.05) between SP600125- and AdoMet-pretreated hepatocytes compared to non-pretreated hepatocytes.
- Citation: Cabrales-Romero MDP, Márquez-Rosado L, Fattel-Fazenda S, Trejo-Solís C, Arce-Popoca E, Alemán-Lazarini L, Villa-Treviño S. S-adenosyl-methionine decreases ethanol-induced apoptosis in primary hepatocyte cultures by a c-Jun N-terminal kinase activity-independent mechanism. World J Gastroenterol 2006; 12(12): 1895-1904
- URL: https://www.wjgnet.com/1007-9327/full/v12/i12/1895.htm
- DOI: https://dx.doi.org/10.3748/wjg.v12.i12.1895


