Copyright
©2006 Baishideng Publishing Group Co.
World J Gastroenterol. Mar 28, 2006; 12(12): 1874-1880
Published online Mar 28, 2006. doi: 10.3748/wjg.v12.i12.1874
Published online Mar 28, 2006. doi: 10.3748/wjg.v12.i12.1874
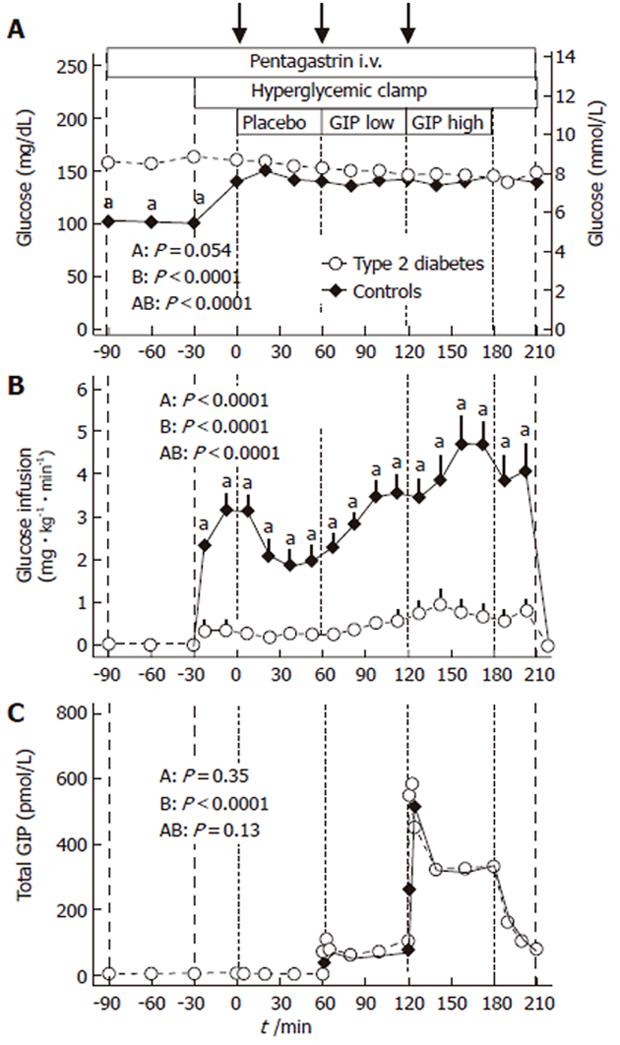
Figure 1 Plasma concentrations of glucose (A), glucose infusion rates (B) and plasma concentrations of total GIP (C) during hyperglycemic clamp experiments with the intravenous infusion of pentagastrin (1 µg .
kg-1 . h-1; -90 to 210 min), placebo (0 - 60 min), GIP at a low dose (1 pmol . kg-1 . min-1; 60-120 min), and GIP at a high dose (4 pmol . kg-1 . min-1; 120 -180 min) in eight patients with type 2 diabetes (open circles) and eight healthy controls (filled diamonds). Arrows indicate bolus administrations of placebo, 20 pmol GIP/kg and 80 pmol GIP/kg, respectively. Data are presented as means ± SEM; P-values were calculated using repeated measures ANOVA and one-way ANOVA and denote A: differences between the groups, B: differences over time and AB: differences due to the interaction of group and time. aP < 0.05 patients with type 2 diabetes at individual time points.
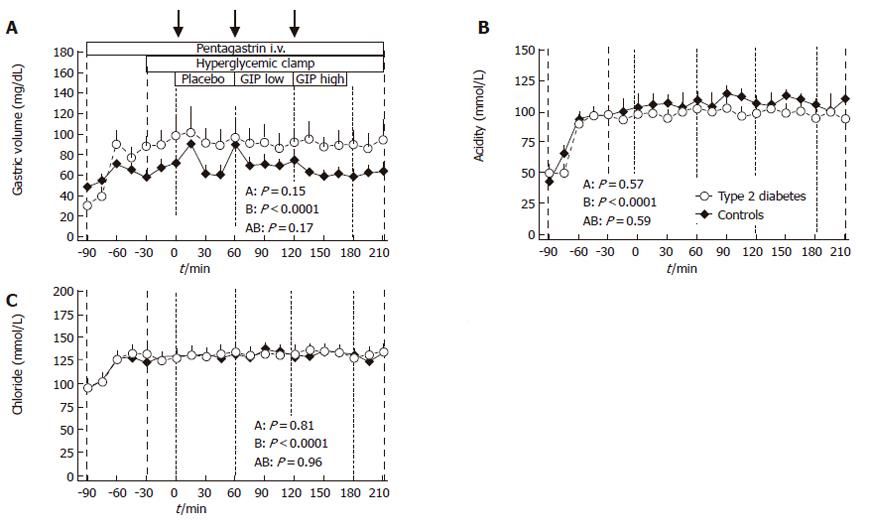
Figure 2 Gastric volume (A), as well as gastric acid (B) and chloride (C) concentrations determined in 15-min intervals in eight patients with type 2 diabetes (open circles) and eight healthy controls (filled diamonds) studied during hyperglycemic clamp experiments with the intravenous infusion of pentagastrin (1 µg .
kg-1 . h-1; -90 to 210 min), placebo (0 - 60 min), GIP at a low dose (1 pmol . kg-1 . min-1; 60-120 min), and GIP at a high dose (4 pmol . kg-1 . min-1; 120 -180 min). Arrows indicate bolus administrations of placebo, 20 pmol GIP/kg and 80 pmol GIP/kg, respectively. Data are presented as means ± SEM; P -values were calculated using repeated measures ANOVA and one-way ANOVA and denote A: differences between the groups, B: differences over time and AB: differences due to the interaction of group and time.
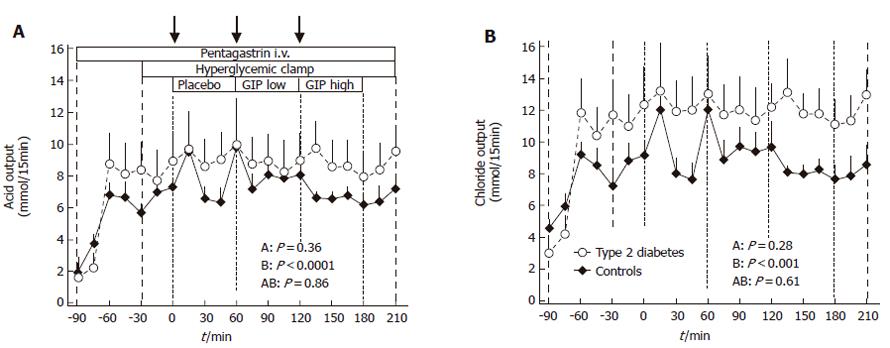
Figure 3 Gastric acid (A), and chloride (B) secretion rates per 15 min in eight patients with type 2 diabetes (open circles) and eight healthy controls (filled diamonds) studied during hyperglycemic clamp experiments with the intravenous infusion of pentagastrin (1 µg .
kg-1 . h-1; -90 to 210 min), placebo (0 - 60 min), GIP at a low dose (1 pmol . kg-1 . min-1; 60-120 min), and GIP at a high dose (4 pmol . kg-1 . min-1; 120 -180 min). Arrows indicate bolus administrations of placebo, 20 pmol GIP/kg and 80 pmol GIP/kg, respectively. Data are presented as means ± SEM; p-values were calculated using repeated measures ANOVA and one-way ANOVA and denote A: differences between the groups, B: differences over time and AB: differences due to the interaction of group and time.
- Citation: Meier JJ, Nauck MA, Kask B, Holst JJ, Deacon CF, Schmidt WE, Gallwitz B. Influence of gastric inhibitory polypeptide on pentagastrin-stimulated gastric acid secretion in patients with type 2 diabetes and healthy controls. World J Gastroenterol 2006; 12(12): 1874-1880
- URL: https://www.wjgnet.com/1007-9327/full/v12/i12/1874.htm
- DOI: https://dx.doi.org/10.3748/wjg.v12.i12.1874


