Copyright
©2006 Baishideng Publishing Group Co.
World J Gastroenterol. Mar 14, 2006; 12(10): 1551-1557
Published online Mar 14, 2006. doi: 10.3748/wjg.v12.i10.1551
Published online Mar 14, 2006. doi: 10.3748/wjg.v12.i10.1551
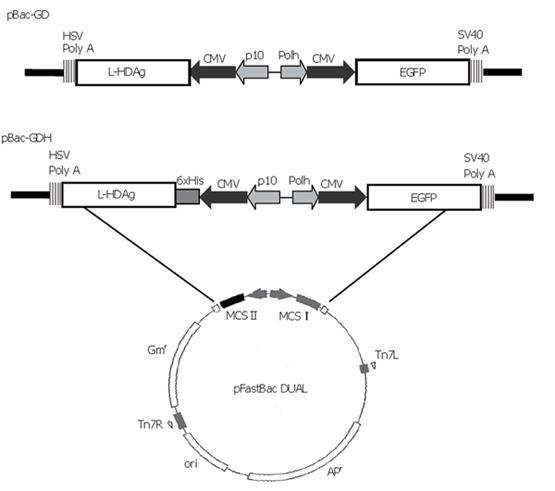
Figure 1 Schematic illustration of recombinant donor plasmids pBac-GDH and pBac-GD
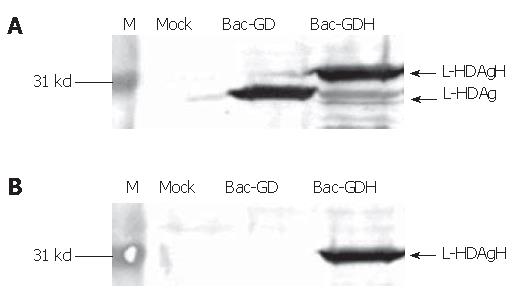
Figure 2 Western blot analysis of proteins expressed by mock-, Bac-GD- or Bac-GDH-transduced BHK cells.
A: Anti-HDV sera; B: Anti-His6 mAb.
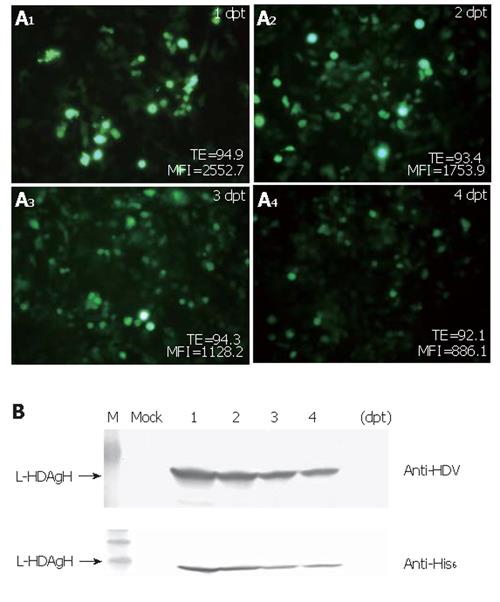
Figure 3 A: Variation of the transduction efficiency (TE) over time post-transduction.
B: Time-course profile of L-HDAgH expression. Western blot using anti-HDV sera and anti-His6 mAb.
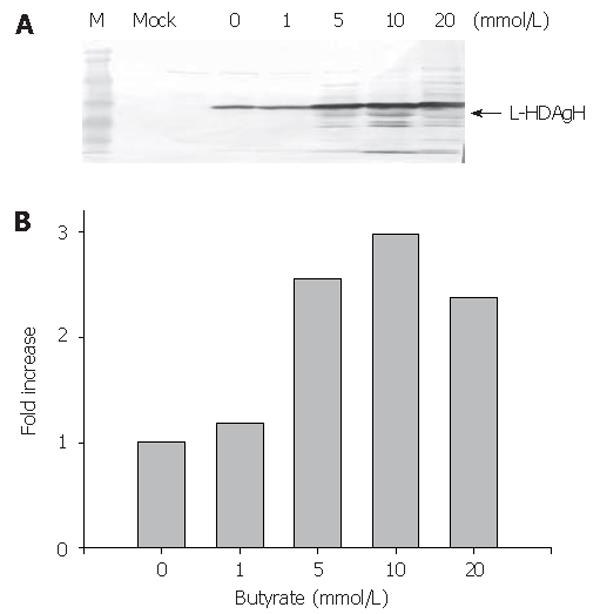
Figure 4 Effects of sodium butyrate on L-HDAgH expression.
A. Western blot; B. The expression levels.
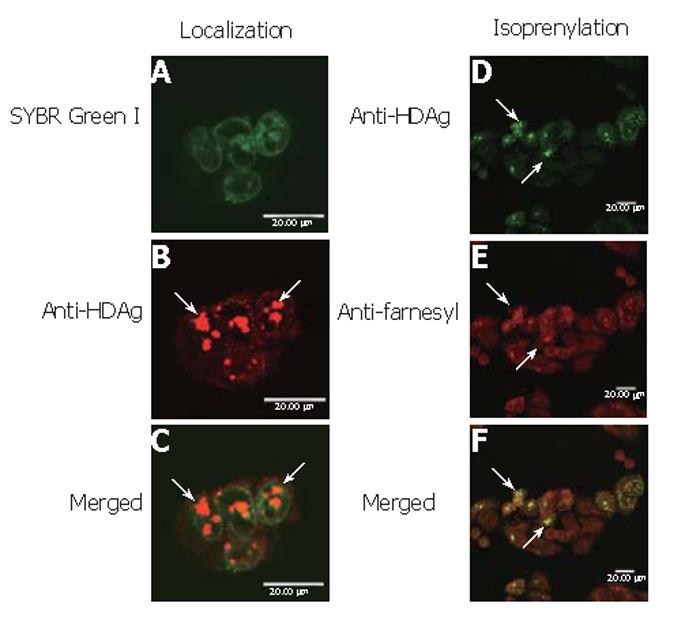
Figure 5 Subcellular localization and isoprenylation of L-HDAgH by immunofluorescence labeling.
A: the presence of nuclei labeled by SYBR green I; B: L-HDAg detected using Cy3-conjugated goat anti-mouse IgG; C: merged photograph of A and B; D: the presence of L-HDAgH labeled by FITC-conjugated mAb; E: The presence of isoprenylation marked by TRITC-conjugated mAb; F:merged photograph of D and E. Bars, 20 μm.
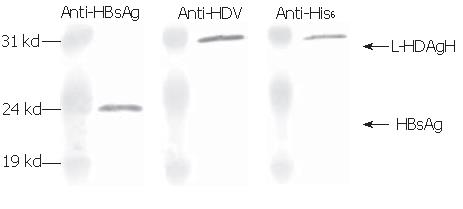
Figure 6 Western blot using anti-HBsAg, anti-HDAg and anti-His6 antibodies.
Figure 7 Western blot (A) and SDS-PAGE(B).
M, marker; ori, original sample; fl, flow through; R, samples stuck in the resin. The numbers indicate the imidazole concentration at which the sample was collected.
- Citation: Chiang YW, Wu JC, Wang KC, Lai CW, Chung YC, Hu YC. Efficient expression of histidine-tagged large hepatitis delta antigen in baculovirus-transduced baby hamster kidney cells. World J Gastroenterol 2006; 12(10): 1551-1557
- URL: https://www.wjgnet.com/1007-9327/full/v12/i10/1551.htm
- DOI: https://dx.doi.org/10.3748/wjg.v12.i10.1551


