Copyright
©2006 Baishideng Publishing Group Co.
World J Gastroenterol. Mar 14, 2006; 12(10): 1536-1544
Published online Mar 14, 2006. doi: 10.3748/wjg.v12.i10.1536
Published online Mar 14, 2006. doi: 10.3748/wjg.v12.i10.1536
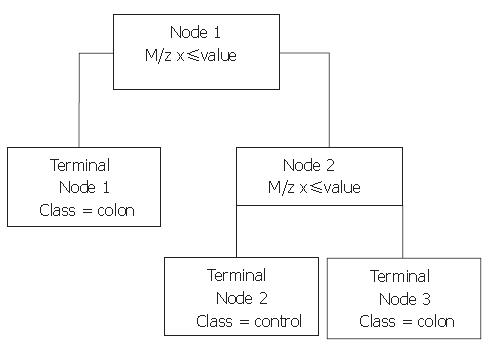
Figure 1 Example of a BPS-generated classification tree distinguishing colorectal cancer patients and healthy controls.
If the peak intensity of an analyzed sample is below the cut-off value at the m/z in the node, the sample proceeds to the left. If not, it proceeds to the right, where its peak intensity at the next m/z is evaluated.
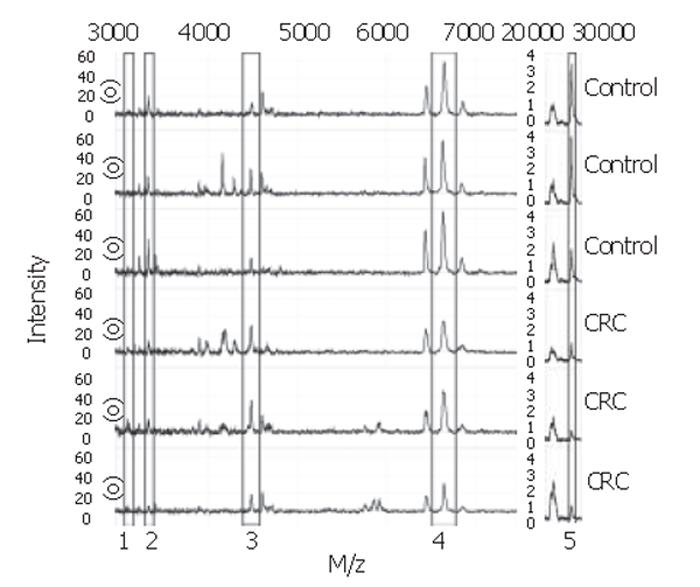
Figure 2 Spectra from colorectal cancer patients and controls.
Biomarker proteins are boxed: 1 = 3.1×10³ Da, 2 = 3.3×10³ Da, 3 = 4.5×10³ Da, 4 = 6.6×10³ Da, 5 = 28×103 Da.
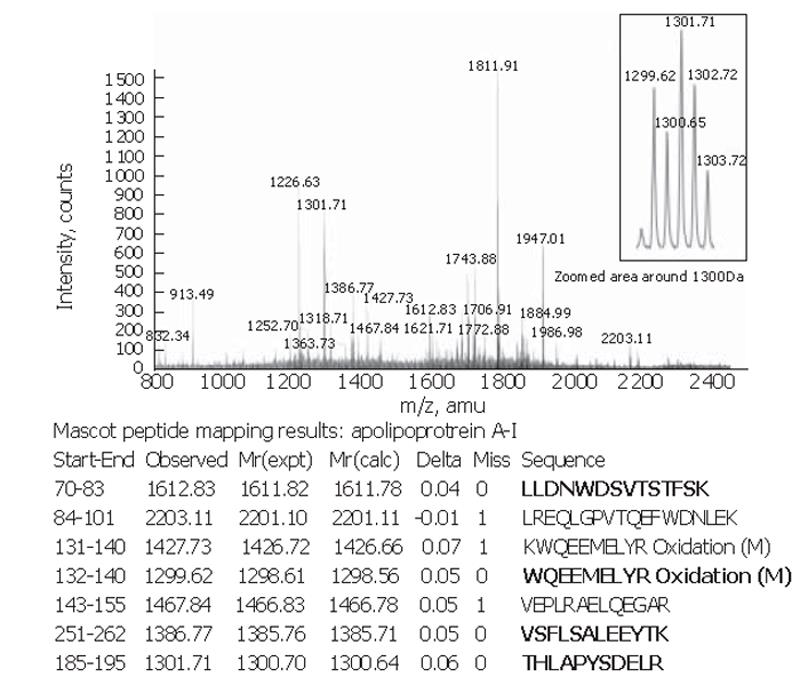
Figure 3 Peptide mapping of 28×103-Da apolipoprotein A-I.
MS spectrum of the 28×103-Da in-gel tryptic digest. Results from the MASCOT search for protein identification include start and end positions of the found peptide sequence starting from the amino acid terminal of the whole protein, the observed m/z, transformed to its experimental mass [Mr(expt)], the calculated mass [Mr(calc)] from the matched peptide sequence, as well as their mass difference (Delta), the number of missed cleavage sites for trypsin (Miss) and the peptide sequence. Peptides in bold were sequenced with tandem MS using Q-TOF for confirmation.
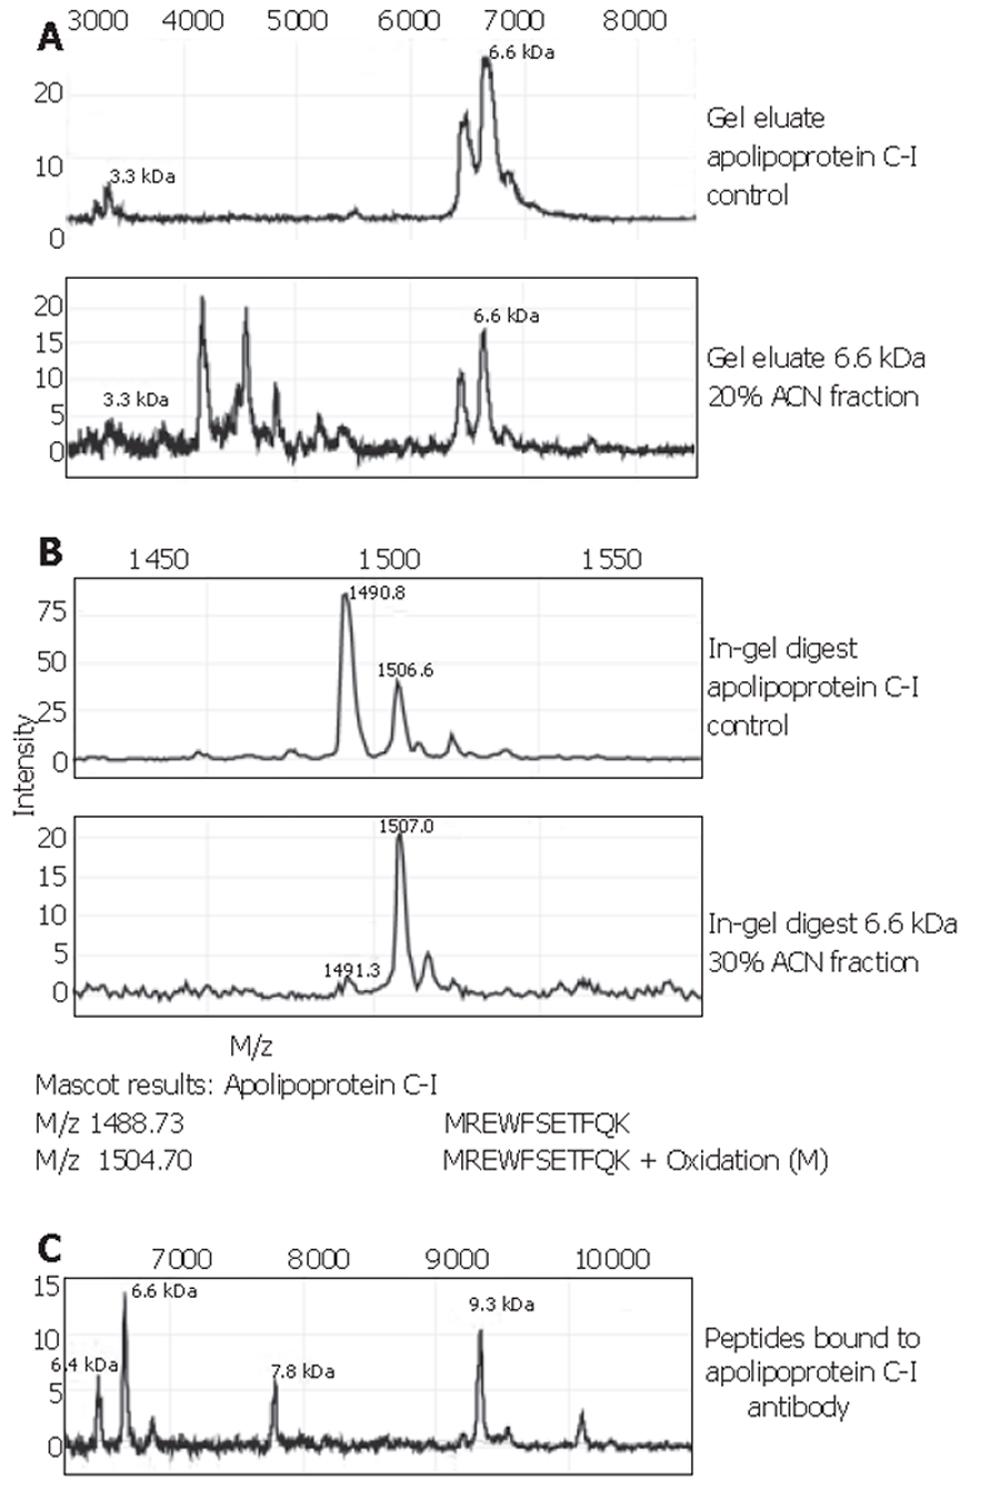
Figure 4 Identification of apolipoprotein C-I.
A: Parts of the MS spectra of the gel eluates of an apolipoprotein C-I control and the 6.6×10³-Da protein isolated from HC serum run on the same gel. B: Parts of the MS spectra of the in-gel digests of an apolipoprotein C-I control and the 6.6×10³-Da protein isolated from HC serum and the results of sequencing of these two peptides with tandem MS. C: Part of the MS spectrum of the eluate from the apolipoprotein C-I antibody. Apart from the expected peaks at 9.3×10³, apolipoprotein C-I precursor, and 6.6×10³, a 6.4×10³-Da peak is seen, which is a known fragment of apolipoprotein C-I missing two N-terminal amino acids. The mass at 7.8×10³ is unknown and does not correspond to any of the apolipoproteins with which antibody cross-reactivity can occur. It is possibly an intermediate splice form of the precursor protein.
Figure 5 ROC curves for biomarker proteins from trees V and VI with and without log(CEA).
Areas under the curve (AUC) are given for each model.
- Citation: Engwegen JY, Helgason HH, Cats A, Harris N, Bonfrer JM, Schellens JH, Beijnen JH. Identification of serum proteins discriminating colorectal cancer patients and healthy controls using surface-enhanced laser desorption ionisation-time of flight mass spectrometry. World J Gastroenterol 2006; 12(10): 1536-1544
- URL: https://www.wjgnet.com/1007-9327/full/v12/i10/1536.htm
- DOI: https://dx.doi.org/10.3748/wjg.v12.i10.1536


