Copyright
©2005 Baishideng Publishing Group Inc.
World J Gastroenterol. Mar 7, 2005; 11(9): 1297-1302
Published online Mar 7, 2005. doi: 10.3748/wjg.v11.i9.1297
Published online Mar 7, 2005. doi: 10.3748/wjg.v11.i9.1297
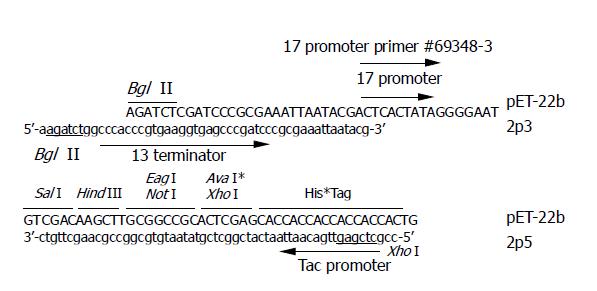
Figure 1 Sequences of primer 2p5 and 2p3.
The last 18 nt of 2p5 correspond to the antisense strand before Xho I site of pET-22b, the nucleotide sequence in gray box of 2p5 correspond to the tac promoter, and the underlined letters represent the Xho I site. The last 21 nt of 2p3 correspond to the sense strand after the Bgl I site of pET-22b, the nucleotide sequence in gray box of 2p3 correspond to the T3 terminator, and the underlined letters represent the Bgl II site.
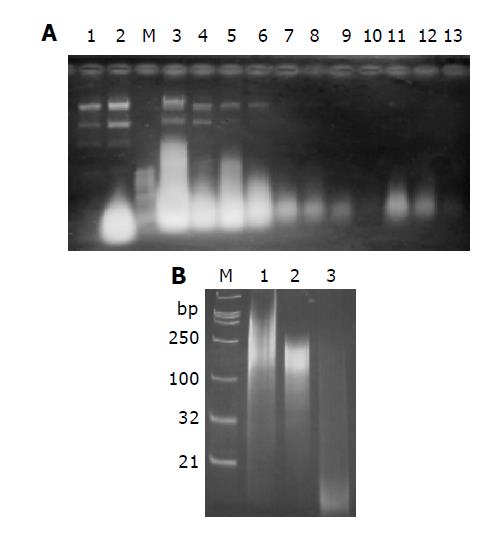
Figure 2 RNAs analysis on 1% agarose gel (A) and 15% non-denaturing polyacrylamide gel (B).
A: RNAs extracted from cells without induction (Lane 1) and with induction with IPTG (Lane 2). The highlight spot represents dsRNAs. dsRNA was purified with CF 11 column as described in materials and methods. Lane 3: RNA extract sample loaded onto CF 11 column; lane 4: flow through; lane 5-10: wash-off with STE containing 18% ethanol (mostly plasmid DNA and single stranded RNA); Lane 11-13: eluate with STE; M: 1 Kb DNA ladder as Marker; B: Digestion analysis of purified dsRNA with RNase A or RNase III. Lane 1: 1 μg undigested purified dsRNA; lane 2: digestion with 0.1 μg RNase A for an hour at 37 °C; lane 3: digestion with 1 U recombinant E. coli RNase III (Ambion) for an hour at 37 °C; M: DNA marker. The length of marker is indicated on the left.
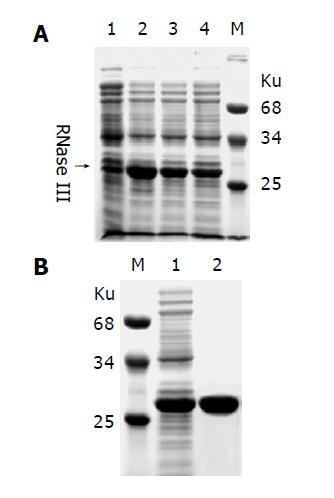
Figure 3 Expression and purification of recombinant E.
coli RNase III. A: E. coli RNase III was expressed as an N-terminal His-tagged fusion protein in E. coli strain BL21(DE3). Lane 1: negative control; lanes 2-4 represent 3 individual clones induced with IPTG; B: The recombinant protein extract (Lane 1) was purified by a single step affinity chromatography with the Ni-NTA His•Bind Resin (Lane 2). Molecular weight of marker proteins is indicated nearby.
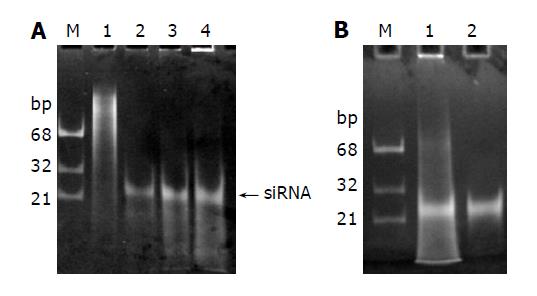
Figure 4 Processing of long dsRNAs into siRNAs with recombinant E.
coli RNase III. A: 1, 3 and 5 μg dsRNAs (Lanes 2-4) were digested with 1 µg RNase III at 37 °C for 1 h in 10 µg reaction mixture containing 50 mmol/l Tris–HCl, 50 mmol/L NaCl, 10 mmol/L MnCl2 and 1 mmol/L DTT (pH 7.5). The siRNA-like products were indicated by an arrow on the right. Lane 1: undigested dsRNAs; B: The siRNAs were recovered from the gel (Lane 2).
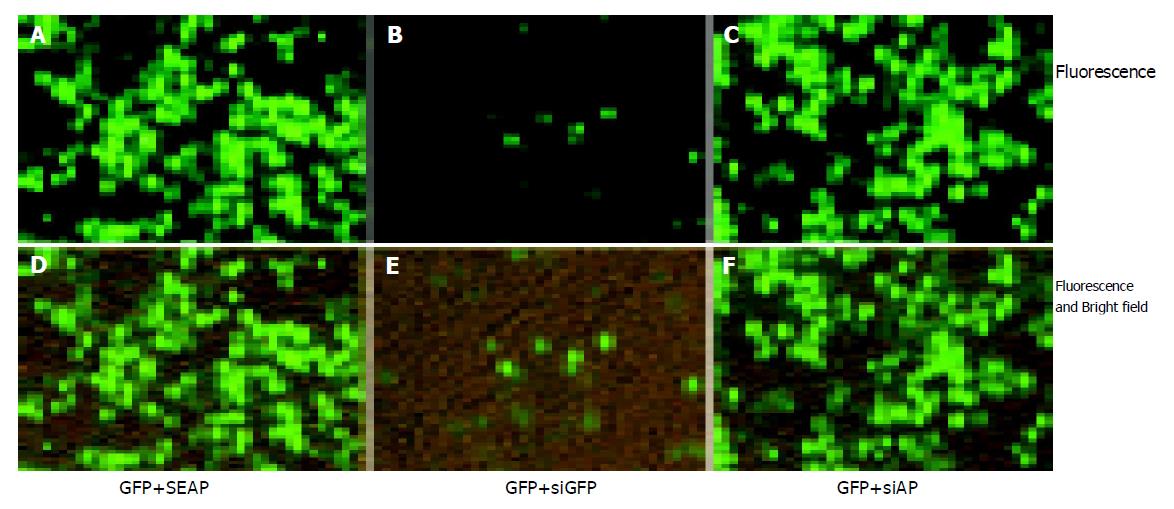
Figure 5 Specific inhibition of GFP expression in SMMC7721 cells.
0.4 μg pEGFP-N2 plasmid DNA were co-transfected with 0.4 μg pSEAP2-control plasmid DNA (A, D) or 0.4 μg siGFP (B, E), or 0.4 μg siAP (C, F) into the SMMC7721 cells in a 24-well plate. Cells were photographed 48 h post transfection. 0.4 μg pSEAP2-control plasmid was added in control group to ensure that transfection parameters remain the same. The total amount of nucleic acids was 0.8 μg for each group and the package efficiency of siRNAs and plasmid DNAs with lipofectamine 2000 was assumed to be equal. The fluorescent and bright-field pictures (D–F) show that the cell density was the same for all groups. Three independent experiments were performed, and one typical picture was shown.
Figure 6 Inhibition of HBsAg expression in SMMC7721 cells.
SMMC7721 cells were co-transfected with 0.4 μg siHBVP and 0.4 μg pEGFP-HBS (HBS+siHBVP) or 0.4 μg pSEAP2-control (SEAP+siHBVP). As control cells were transfected with 0.4 μg siAP and 0.4 μg pEGFP-HBS (HBS+siAP) or 0.4 μg pSEAP2-control (SEAP+siAP). The positive control group was co-transfected with 0.4 μg pEGFP-HBS and 0.4 μg pSEAP2-control (SEAP+HBS). 48 h post transfection. The supernatants were collected for measuring expression level of secreted alkaline phosphatase, and the cells were lysed with RIPA Buffer for measuring HBsAg expression. A: shows the SEAP and HBsAg expression level represented by OD values; B, C: show the HBsAg or SEAP expression level relative to the positive control. Values represent averages of three independent experiments, with the error bars indicating the standard deviation.
Figure 7 Dose dependent inhibition of HBsAg expression in HepG2 cells.
0, 5, 15 or 50 ng siHBVP was co-transfected with 0.35 μg pUC-HBV2 and 0.35 μg pSEAP2-control into HepG2 cells. The supernatant of culture media were removed every 24 h and fresh media were added. The HBsAg and alkaline phosphatase secreted into the culture media were measured. A and C show the HBsAg or SEAP expression level represented by OD values. B shows the HBsAg expression level relative to the positive control. Values represent averages of three independent experiments, with the error bars indicating the standard deviation.
- Citation: Qian ZK, Xuan BQ, Min TS, Xu JF, Li L, Huang WD. Cost-effective method of siRNA preparation and its application to inhibit hepatitis B virus replication in HepG2 cells. World J Gastroenterol 2005; 11(9): 1297-1302
- URL: https://www.wjgnet.com/1007-9327/full/v11/i9/1297.htm
- DOI: https://dx.doi.org/10.3748/wjg.v11.i9.1297


