Copyright
©2005 Baishideng Publishing Group Inc.
World J Gastroenterol. Feb 21, 2005; 11(7): 943-947
Published online Feb 21, 2005. doi: 10.3748/wjg.v11.i7.943
Published online Feb 21, 2005. doi: 10.3748/wjg.v11.i7.943
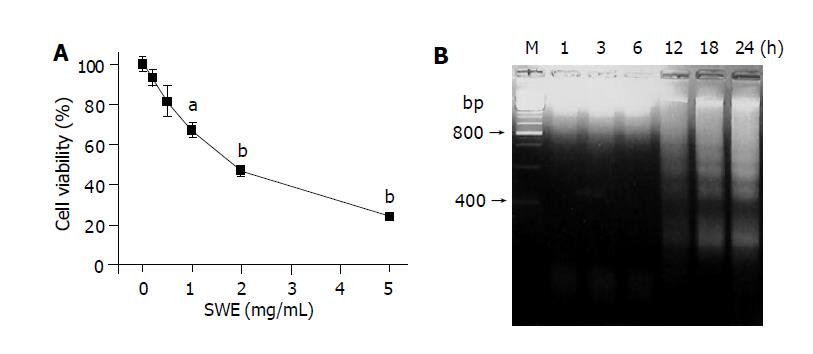
Figure 1 Effects of SWE on cell viability (A) and DNA fragmentation (B).
A: Cells (1×10⁴) treated with various concentrations of SWE for 24 h; B: Cells (3×10⁶) treated with 2.0 mg/mL SWE for the indicated time periods. aP<0.05, bP<0.01 vs control.
Figure 2 Role of mitochondrial alterations in SWE-treated HepG2 cells.
A: Cells (5×10⁵) treated with 2.0 mg/mL SWE for the indicated time periods; B and C: Cells pretreated for 30 min with 5 μmol/L CsA and then treated with 2.0 mg/mL SWE for 6 h. aP<0.05 vs control.
Figure 3 SWE induces the activation of caspase-3 and PARP cleavage in HepG2 cells.
A: HepG2 cells (1.5×10⁷) treated with 0-5.0 mg/mL of SWE for 24 h; B and C: HepG2 cells treated with 2.0 mg/mL SWE for the indicated time periods. aP<0.05, bP<0.01 vs control.
Figure 4 Inhibition of SWE-induced caspase-3 activation (A), PARP cleavage (B) and DNA fragmentation (C) by caspase-3 inhibitor or MPT inhibitor.
HepG2 cells were pretreated with Ac-DEVD-CHO (25 μmol/L) for 1 h or CsA (5 μmol/L) for 30 min followed by treatment with 2.0 mg/mL SWE for further 24 h. Lane M: DNA marker, lane 1: control, lane 2: 2.0 mg/mL SWE, lane 3: 2.0 mg/mL SWE with 5 μmol/L CsA, lane 4: 2.0 mg/mL SWE with 25 μmol/L Ac-DEVD-CHO. bP<0.01 vs control; dP<0.01 vs SWE alone.
- Citation: Kwon KB, Kim EK, Lim JG, Jeong ES, Shin BC, Jeon YS, Kim KS, Seo EA, Ryu DG. Molecular mechanisms of apoptosis induced by Scorpio water extract in human hepatoma HepG2 cells. World J Gastroenterol 2005; 11(7): 943-947
- URL: https://www.wjgnet.com/1007-9327/full/v11/i7/943.htm
- DOI: https://dx.doi.org/10.3748/wjg.v11.i7.943


