Copyright
©2005 Baishideng Publishing Group Inc.
World J Gastroenterol. Feb 21, 2005; 11(7): 1023-1027
Published online Feb 21, 2005. doi: 10.3748/wjg.v11.i7.1023
Published online Feb 21, 2005. doi: 10.3748/wjg.v11.i7.1023
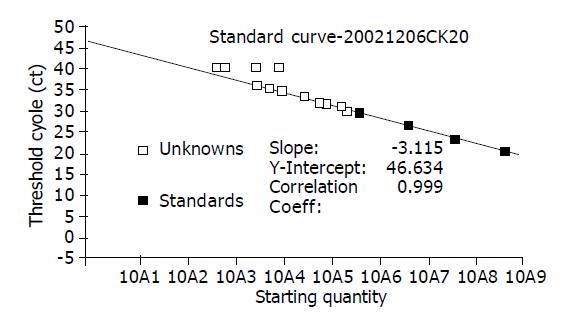
Figure 1 CK20mRNA Standard Curve: 3 until 15 cycles were the baseline and its standard deviation was calculated.
Ct (threshold cycle) values were calculated by determining the point at which the fluorescence exceeded a threshold limit.
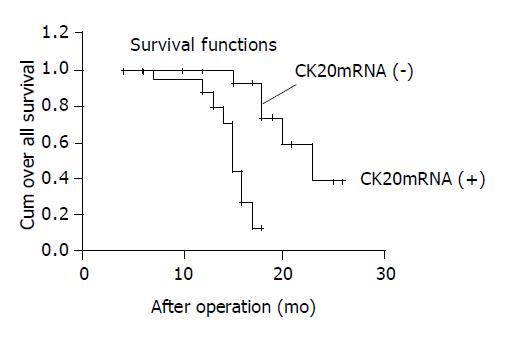
Figure 2 Kaplan-Meier analysis for overall survival according to CK20mRNA expression in patients with pancreatic cancer (log-rank = 13.
31, P = 0.0003).
- Citation: Zhang YL, Feng JG, Gou JM, Zhou LX, Wang P. Detection of CK20mRNA in peripheral blood of pancreatic cancer and its clinical significance. World J Gastroenterol 2005; 11(7): 1023-1027
- URL: https://www.wjgnet.com/1007-9327/full/v11/i7/1023.htm
- DOI: https://dx.doi.org/10.3748/wjg.v11.i7.1023


