Copyright
©2005 Baishideng Publishing Group Inc.
World J Gastroenterol. Feb 7, 2005; 11(5): 733-736
Published online Feb 7, 2005. doi: 10.3748/wjg.v11.i5.733
Published online Feb 7, 2005. doi: 10.3748/wjg.v11.i5.733
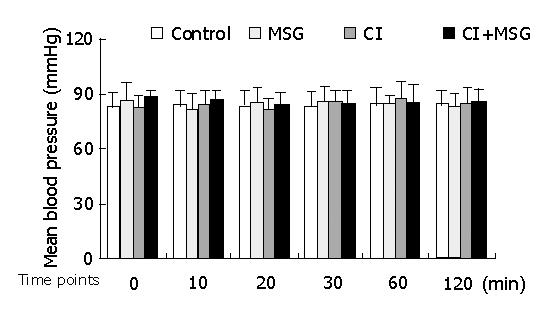
Figure 1 Mean artery pressure (MAP) changes during cerebral ischemia and MSG insults.
There were no significant changes between inter-groups or intra-groups.
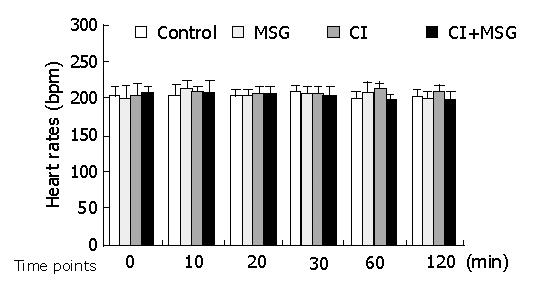
Figure 2 Heart rate changes during cerebral ischemia and MSG insults.
There were no significant changes between inter-groups or intra-groups.
Figure 3 TNF-α production in intestine (A) and cerebra (B).
TNF-α concentrations elevated in MSG-treated and ischemia/MSG-treated rats. Compared with that of MSG-treated rats, TNF-α levels deceased one-fold in ischemia/MSG-treated rats. aP<0.05 vs control, bP<0.01 vs control, cP<0.05 vs MSG group.
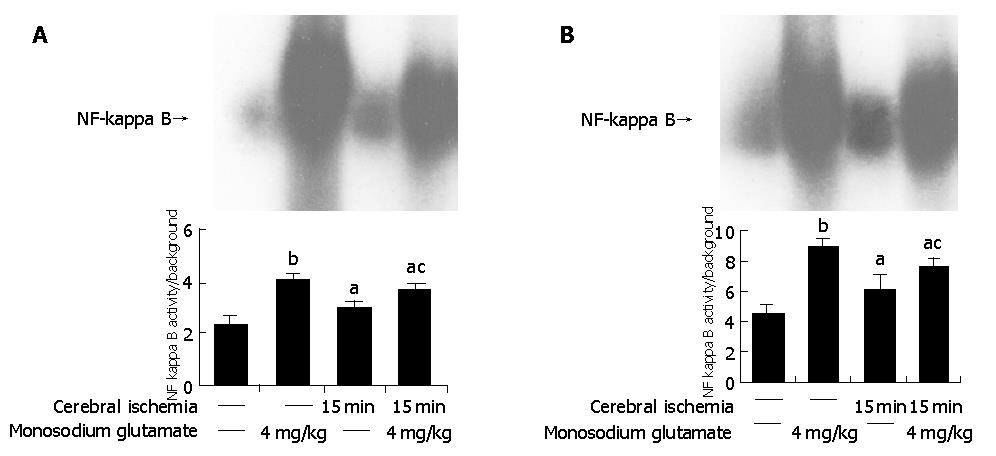
Figure 4 NF-κB activation in intestinal tissues (A) and in cerebral tissue (B).
Lane1: controls, lane 2: MSG-treated rats, lane 3:cerebral-ischemic rats, lane 4: NF-κB intensity of ischemia/MSG-treated rats aP<0.05 vs control, bP<0.01 vs control, cP<0.05 vs MSG-treatment.
- Citation: Xu L, Sun J, Lu R, Ji Q, Xu JG. Effect of glutamate on inflammatory responses of intestine and brain after focal cerebral ischemia. World J Gastroenterol 2005; 11(5): 733-736
- URL: https://www.wjgnet.com/1007-9327/full/v11/i5/733.htm
- DOI: https://dx.doi.org/10.3748/wjg.v11.i5.733


