Copyright
©2005 Baishideng Publishing Group Inc.
World J Gastroenterol. Feb 7, 2005; 11(5): 690-694
Published online Feb 7, 2005. doi: 10.3748/wjg.v11.i5.690
Published online Feb 7, 2005. doi: 10.3748/wjg.v11.i5.690
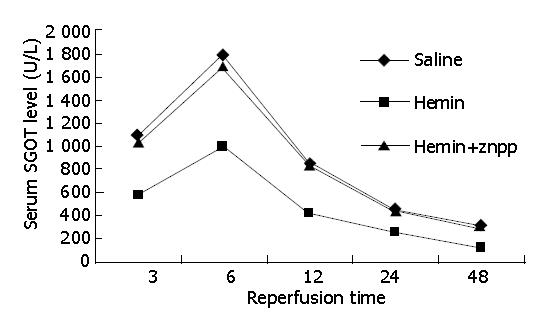
Figure 1 Comparison of serum SGOT levels in hemin group and in saline and hemin+ZnPP groups (P<0.
05). there was no difference between the two groups. After a 6-h reperfusion, the serum SGOT level was the highest.
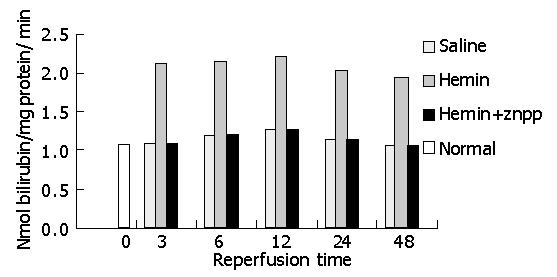
Figure 2 Enzymatic assay for HO-1 activity.
Figure 3 TUNEL-positive cells in (A) and saline-pretreated group (B) hemin-pretreated group (A) and (×200).
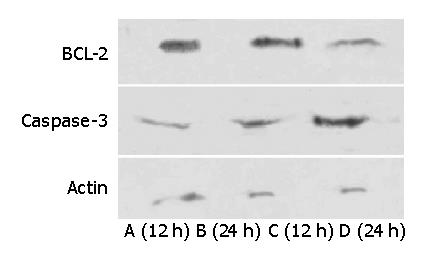
Figure 4 Western blot analyses of Bcl-2 and caspase-3 in orthotopic liver transplants at 12 h (lanes A and C) and 24 h (lanes B and D) after transplantation.
At 12 and 24 h, higher levels of antiapoptotic Bcl-2 were found in hemin–treated livers (lanes A and B) as compared to saline controls (lanes C and D). Proapoptotic caspase-3 decreased in hemin–treated livers (lanes A and B) as compared to saline controls (lanes C and D).
- Citation: Wang XH, Wang K, Zhang F, Li XC, Li J, De W, Guo J, Qian XF, Fan Y. Heme oxygenase-1 alleviates ischemia/reperfusion injury in aged liver. World J Gastroenterol 2005; 11(5): 690-694
- URL: https://www.wjgnet.com/1007-9327/full/v11/i5/690.htm
- DOI: https://dx.doi.org/10.3748/wjg.v11.i5.690


