Copyright
©2005 Baishideng Publishing Group Inc.
World J Gastroenterol. Nov 14, 2005; 11(42): 6631-6637
Published online Nov 14, 2005. doi: 10.3748/wjg.v11.i42.6631
Published online Nov 14, 2005. doi: 10.3748/wjg.v11.i42.6631
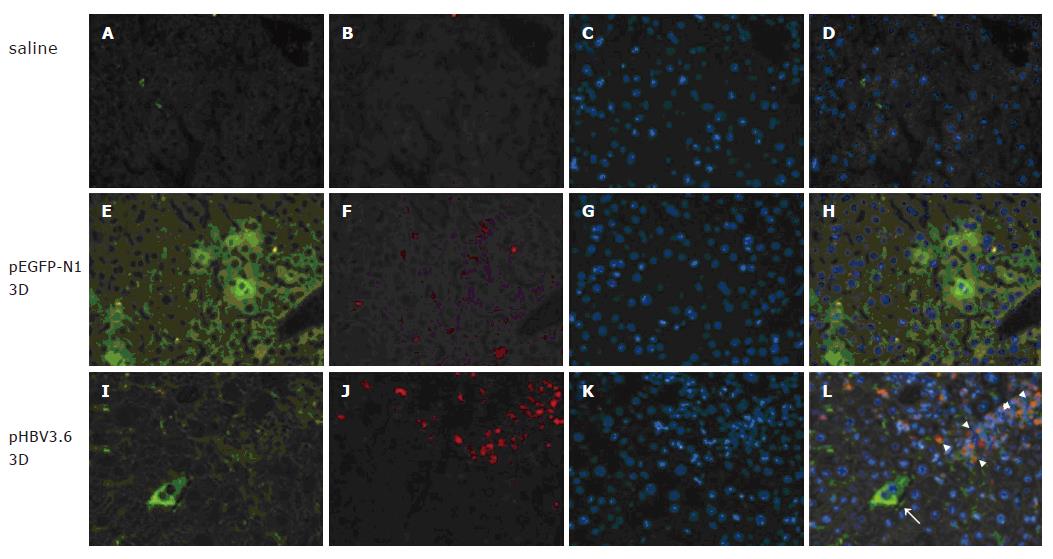
Figure 1 TLR4 expression in the liver of C3H/HeN mice after hydro-dynamic injection of pHBV3.
6. Groups of four C3H/HeN mice were injected intravenously with 10 μg of plasmid by hydrodynamics-based transfection. The liver tissues were collected at day 3 post injection and 4-μm cryosections were made, stained with anti-HBsAg-FITC and anti-TLR4-PE antibody. The green represents EGFP-positive (E) or HBsAg-positive cells (I) and the red represents TLR4-positive cells (B, F, J). The blue represents counter staining by Hoechst 33258 dye (C, G, K). A-D: naïve; E-H: pEGFP-N1; I–L: pHBV3.6. The arrows indicate the HBsAg positive hepatocytes and the arrowheads indicate the TLR4 positive immune cells (original magnification ×200)
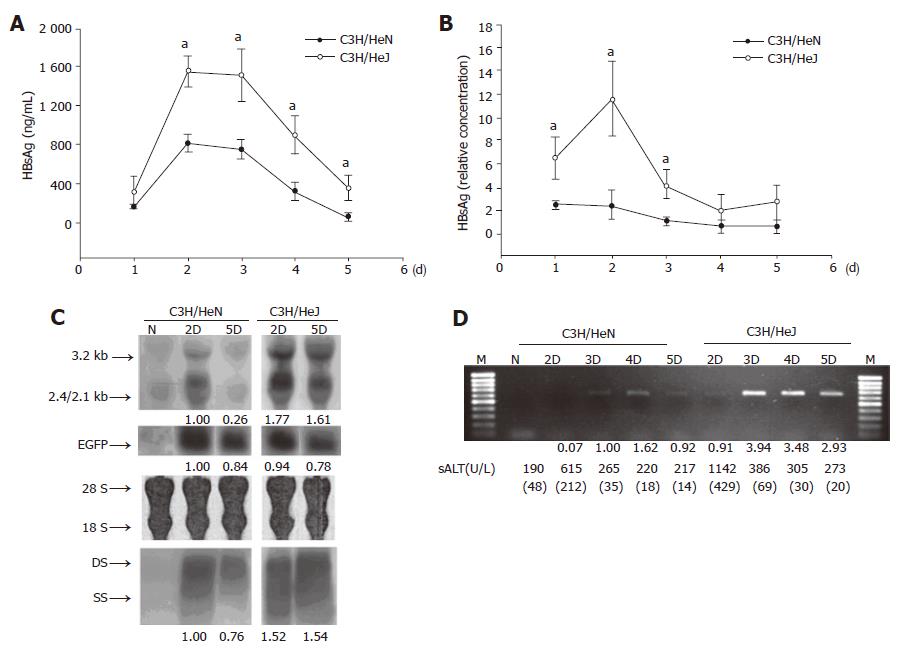
Figure 2 HBV antigenemia and replication in TLR4-mutant C3H/HeJ mice or normal C3H/HeN mice.
Groups of four C3H/HeN or C3H/HeJ mice were injected intravenously with 10 μg of pHBV3.6 and 10 μg of pEGFP-N1 that was used as control of transfection efficiency by hydrodynamics-based transfection. The HBsAg (A) or HBeAg (B) in the serum was detected by ELISA kits as described in Materials and methods. aP<0.05. (C) The total RNA or cytoplasmic DNA was purified from liver and hybridized with HBV specific probes to analyze the HBV transcription or replication. The number below each land of Northern or Southern blot was represented as the relative fold of expression comparing to d2 result of C3H/HeN mice. N, naïve C3H/HeN. (D) The serum DNA was purified after treatment with 20 U DNase I and the HBV-DNA was detected by PCR method. The number below each land was represented as the relative fold of expression comparing to d3 result of C3H/HeN mice. M, 100-bp DNA ladder; N, naïve C3H/HeN. The sALT level was represented as mean (SD).
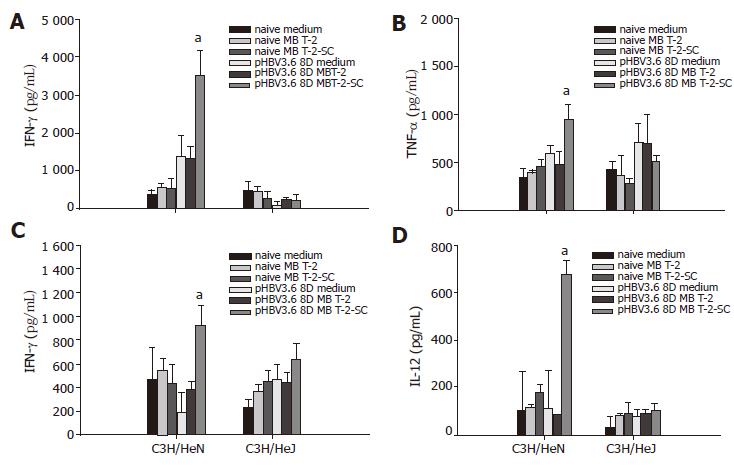
Figure 3 HBV-specific immune responses in the liver or spleen of C3H/HeN or C3H/HeJ mice after hydrodynamic-injection of pHBV3.
6. Groups of four C3H/HeN or C3H/HeJ mice were injected intravenously with 10 μg of pHBV3.6 by hydrodynamics-based transfection. The intrahepatic lymphocytes (A and B) or splenocytes (C and D) were isolated at d 8 post injection. After being co-cultured with HBsAg and HBcAg expressing syngenic MBT-2 cells (MBT-2-SC) for 48 h, the IFN-γ (A and C), TNF-α (B) or IL-12 (D) in the culture supernatant was analyzed by ELISA method. aP<0.05 vs naïve MBT-2-SC group.
Figure 4 iNOS expression in the liver of C3H/HeN or C3H/HeJ mice after hydrodynamic-injection of pHBV3.
6. Groups of four C3H/HeN (C, D) or C3H/HeJ (G, H) mice were injected intravenously with 10 μg of pHBV3.6 by hydrodynamics-based transfection. Serial sections of frozen liver tissue were made and stained with anti-HBs antibody (B, D, F, H) or anti-iNOS antibody (A, C, E, G). Red color was developed and indicated the positive staining. The insets in (C), (D), (G), and (H) represent twofold magnification of positive staining. A, B, E, F, saline injected control mice; C, D, G, H, day 2 post injection (original magnification ×200).
Figure 5 HBV replication was reduced in C3H/HeJ mice after adoptive transfer of splenocytes from C3H/HeN mice.
5×10⁶ splenocytes from C3H/HeN or C3H/HeJ mice were injected into C3H/HeJ or C3H/HeN mice intravenously at the day before pHBV3.6 injection, respectively. (A) The HBsAg in sera was detected as indicated day by ELISA. aP<0.05. (B) The total RNA or cytoplasmic DNA of liver was isolated at day 3 and was further analyzed for HBV transcription or replication by Northern or Southern blot. The transfection efficiency was verified by co-injection of pEGFP-N1 and EGFP RNA confirmation. The number below each land of Northern or Southern blot was represented as the relative fold of expression comparing to C3H/HeN mice. N, C3H/HeN; J, C3H/HeJ; SP, splenocytes. (C) The HBV-DNA in sera was isolated as on the indicated day and detected by PCR method. The number below each land was represented as the relative fold of expression comparing to day 2 result of C3H/HeN mice. M, 100-bp DNA ladder; Neg, no template control; P, pHBV3.6 5 ng; N, C3H/HeN; J, C3H/HeJ; SP, splenocytes.
- Citation: Chang WW, Su IJ, Lai MD, Chang WT, Huang W, Lei HY. Toll-like receptor 4 plays an anti-HBV role in a murine model of acute hepatitis B virus expression. World J Gastroenterol 2005; 11(42): 6631-6637
- URL: https://www.wjgnet.com/1007-9327/full/v11/i42/6631.htm
- DOI: https://dx.doi.org/10.3748/wjg.v11.i42.6631


