Copyright
©The Author(s) 2005.
World J Gastroenterol. Nov 14, 2005; 11(42): 6582-6586
Published online Nov 14, 2005. doi: 10.3748/wjg.v11.i42.6582
Published online Nov 14, 2005. doi: 10.3748/wjg.v11.i42.6582
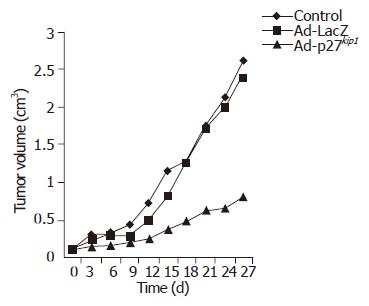
Figure 1 The growth curves of tumor.
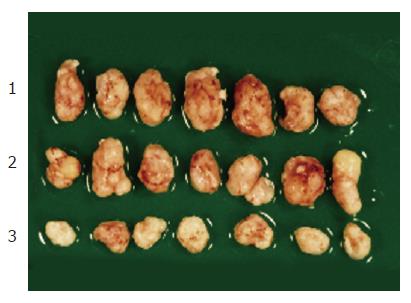
Figure 2 Growth suppression of Ad-p27kip1 on established esophageal carcinoma xenografts.
1: control group; 2: Ad-LacZ group; 3: Ad-p27kip1 group.
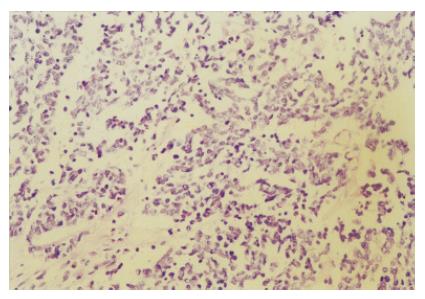
Figure 3 Hematoxylin and eosin (H&E) staining of established esophageal carcinoma xenografts (×200).
Figure 4 Result of immunohistochemical staining of tumors in nude mice.
A: control group. p27kip1 protein located in cytoplasm of a few cells showing low expression; B: Ad-LacZ group. The result showed low expression also; C: Ad-p27kip1 group. p27kip1 protein located in cytoplasm and nucleus showing high expression (×200).
Figure 5 Result of immunohistochemical staining of tumors in nude mice.
A: control group. Survivin protein located in cytoplasm showing high expression; B: Ad-LacZ group. The result showed high expression also; C: Ad-p27kip1 group. Survivin protein located in cytoplasm of a few cells showing low expression (×200).
-
Citation: Zhang WG, Wu QM, Yu JP, Tong Q, Xie GJ, Wang XH, Li SB. Adenovirus expressing p27
kip1 suppresses growth of established esophageal carcinoma xenografts. World J Gastroenterol 2005; 11(42): 6582-6586 - URL: https://www.wjgnet.com/1007-9327/full/v11/i42/6582.htm
- DOI: https://dx.doi.org/10.3748/wjg.v11.i42.6582


