Copyright
©2005 Baishideng Publishing Group Inc.
World J Gastroenterol. Oct 28, 2005; 11(40): 6338-6347
Published online Oct 28, 2005. doi: 10.3748/wjg.v11.i40.6338
Published online Oct 28, 2005. doi: 10.3748/wjg.v11.i40.6338
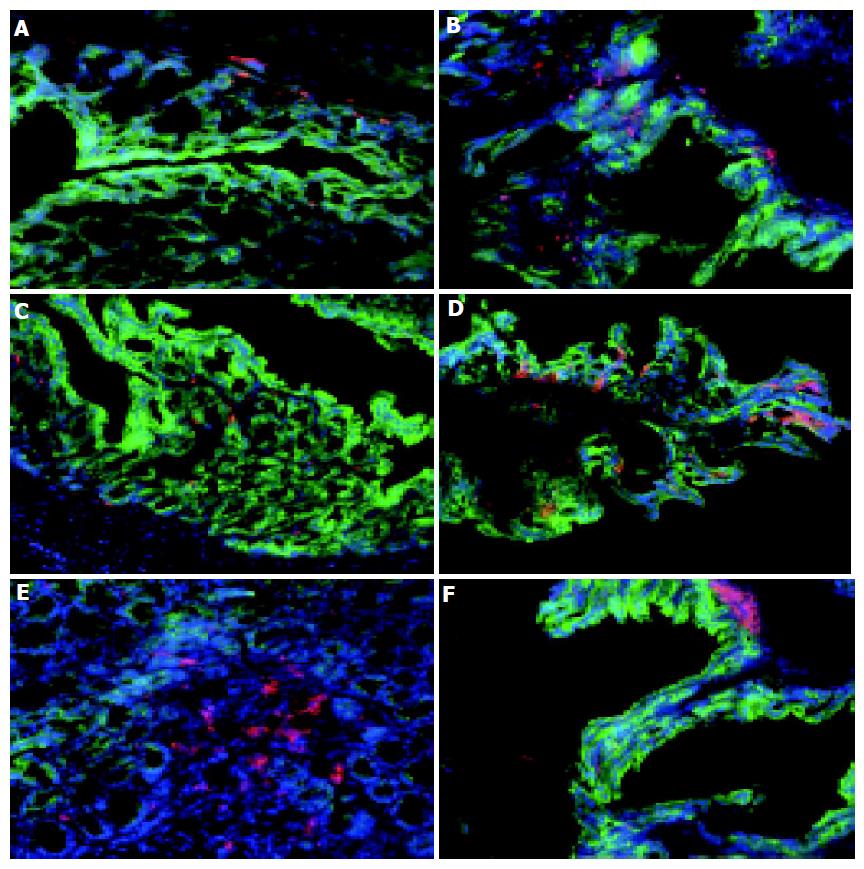
Figure 1 Distribution of macrophages and DC in normal and colitic colon.
Sections of cryopreserved colon from normal C57BL/6 (A, C, and E) and colitic C57BL/6-IL2-/- mice (B, D, and F) were labeled with F4/80 and Cy-3 to identify macrophages (A and B), CD11c and Cy-3 to identify DC (C-F) and cytokeratin-FITC to identify epithelial cells (A-F) and counterstained with DAPI. Although there were increased numbers of macrophages in colitic animals, their distribution was unaltered (A and B). The number of DC was increased in the inflamed colon and their distribution was altered with DC being found in close proximity to the epithelium (C and D). Aggregates of CD11c+ DC were also observed at the base of villi of both normal and colitic colons (E and F). Magnification, ×160. Tissue was analyzed from the colons of 5 C57BL/6-IL2-/- and 4 C57BL/6 animals.
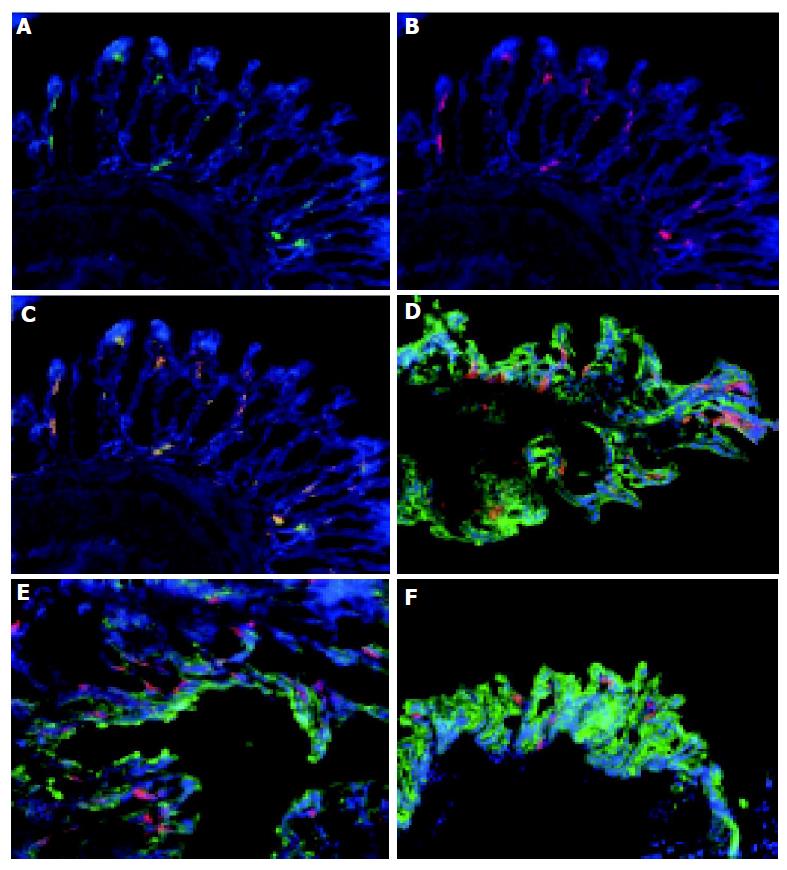
Figure 2 Colonic DC are myeloid DC which are distributed throughout the colon.
Frozen sections of normal colon were stained with MAC-1 and FITC (A), CD11c and Cy3 (B) and counterstained with DAPI. The overlay of the combined images (C) shows that CD11c and MAC-1 co-localized (yellow) consistent with these cells being MAC-1+, CD11c+ myeloid DC. Tissue from the proximal (D), mid (E), and distal (F) colon of normal animals were immunolabeled with CD11c-Cy.3 to identify DC, cytokeratin-FITC to identify epithelial cells and counterstained with DAPI. DC were distributed throughout the colon. Magnification, ×160. Tissue was analyzed from the colons of 5 C57BL/6-IL2-/- and 4 C57BL/6 animals.
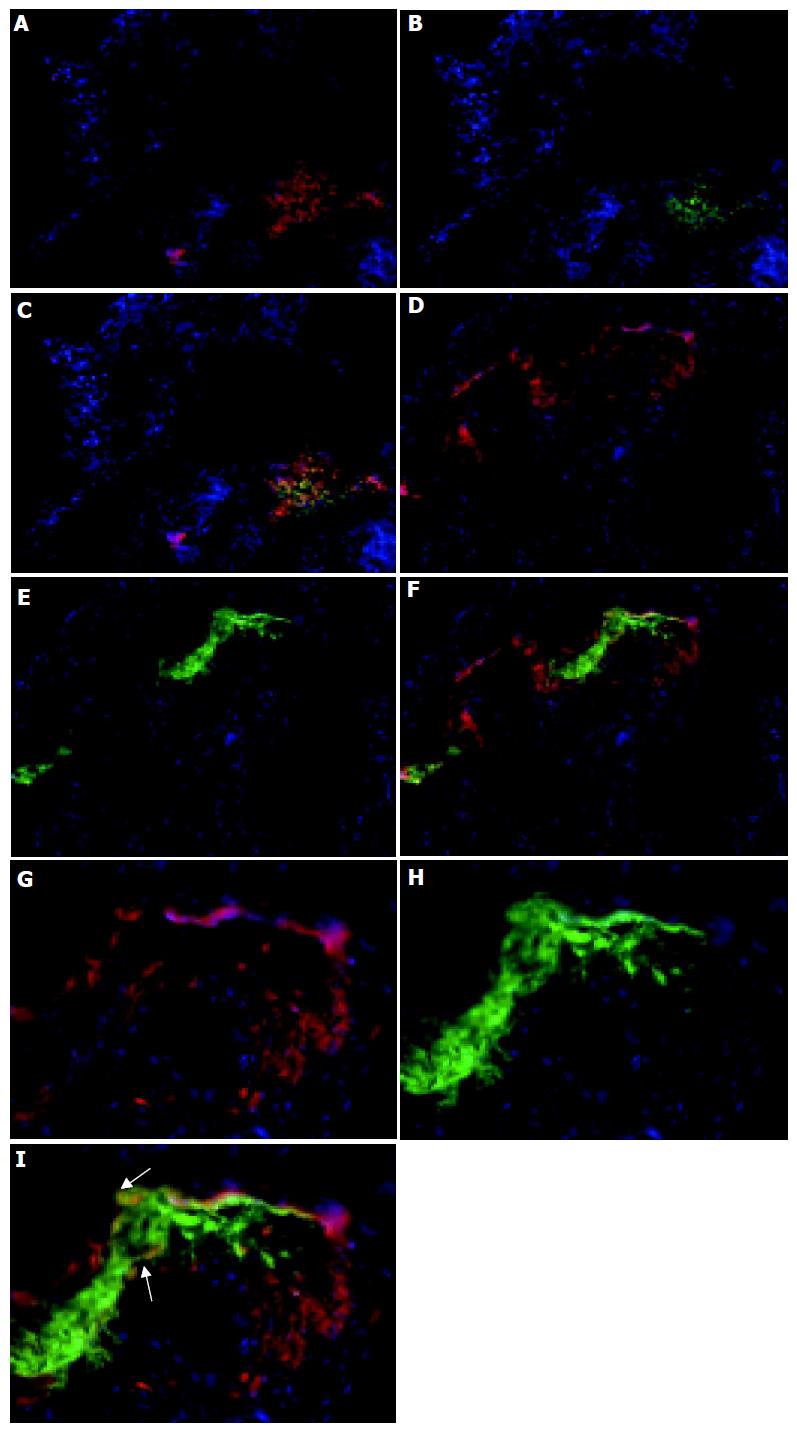
Figure 3 Lymphoid follicles in the colon.
Colon sections were immunolabeled with CD11c and Cy3 to identify DC (red, A, C, D, F, G, and I), CD4 and FITC to identify Th cells (B and C) and B220 and FITC to identify B cells (E, F, H, and I) and counterstained with DAPI. Magnification, ×160. The bottom panel shows that there are B220+ CD11c+ cells (yellow) within the lymphoid follicles of colitic mice (magnification, ×400). The dual stained cells have been arrowed to indicate their localization. Tissue was analyzed from the colons of 5 C57BL/6-IL2-/- and 4 C57BL/6 animals.
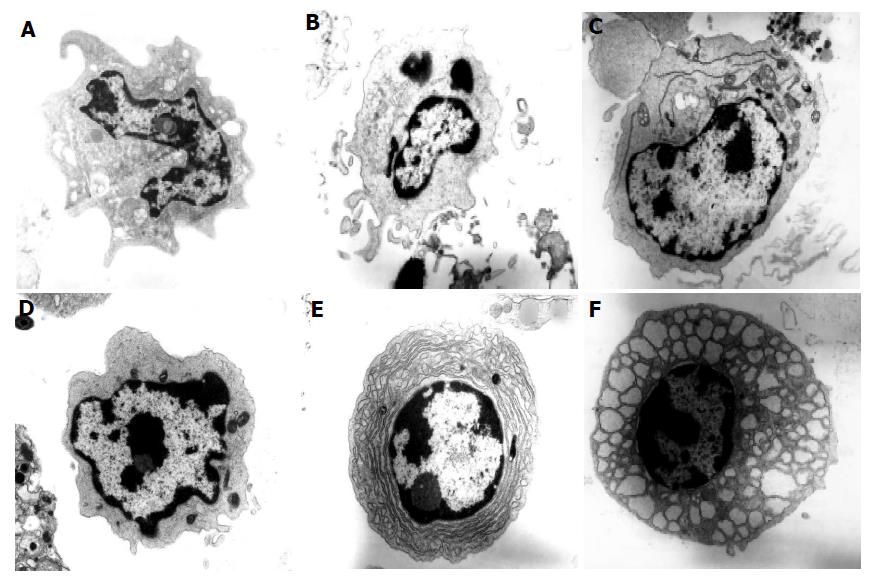
Figure 4 Electron micrographs of colonic DC from normal and colitic mice.
Electron micrographs of cells from the colonic LP of normal C57BL/6 and colitic C57BL/6-IL2-/- mice showing (A) dendritic cell type 1 (myeloid DC) from a C57BL/6 mouse (×17 250), (B) dendritic cell type 1-2 from C57BL/6-IL2-/- mouse (×17 250), (C) dendritic cell type 2 (plasmacytoid DC) from C57BL/6-IL2-/- mouse (×13 800) with prominent RER, (D) dendritic cell type 1 (myeloid DC) from C57BL/6-IL2-/- mouse (×23 000), (E) plasma cell from C57BL/6-IL2-/- mouse (×17 250) and (F) Mott cell from C57BL/6-IL2-/- mouse (×17 250). Tissue was analyzed from the colons of 3 C57BL/6-IL2-/- and 3 C57BL/6 animals.
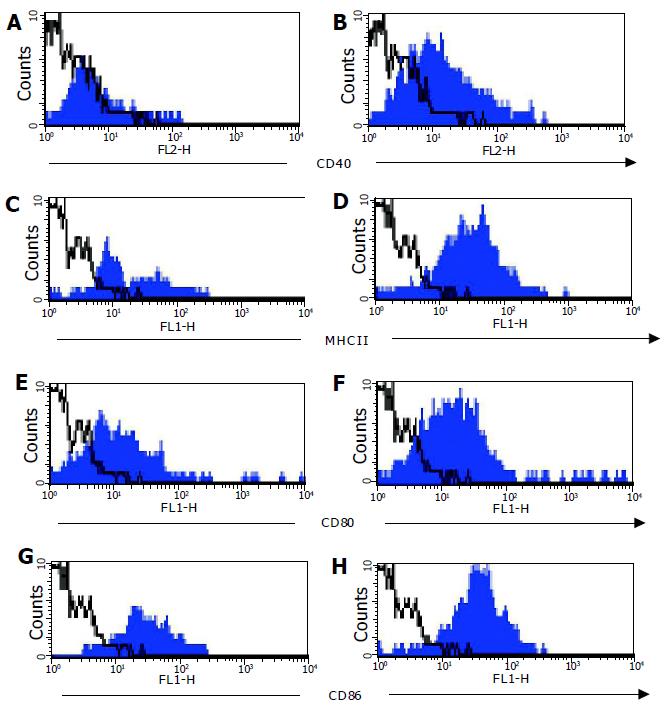
Figure 5 Co-stimulatory molecule expression on colonic LP DC.
Expression of CD40 (A+B), MHCII (C+D), CD80 (D+E), and CD86 (G+H) was analyzed on CD11c+ colonic LP DC from normal C57BL/6 (filled histogram left hand panel) and C57BL/6-IL2-/- (filled histogram right hand panel) mice by flow cytometry. Isotype control staining is represented by the open histograms with a dotted line. Data shown is a representative experiment from a total of six independent experiments.
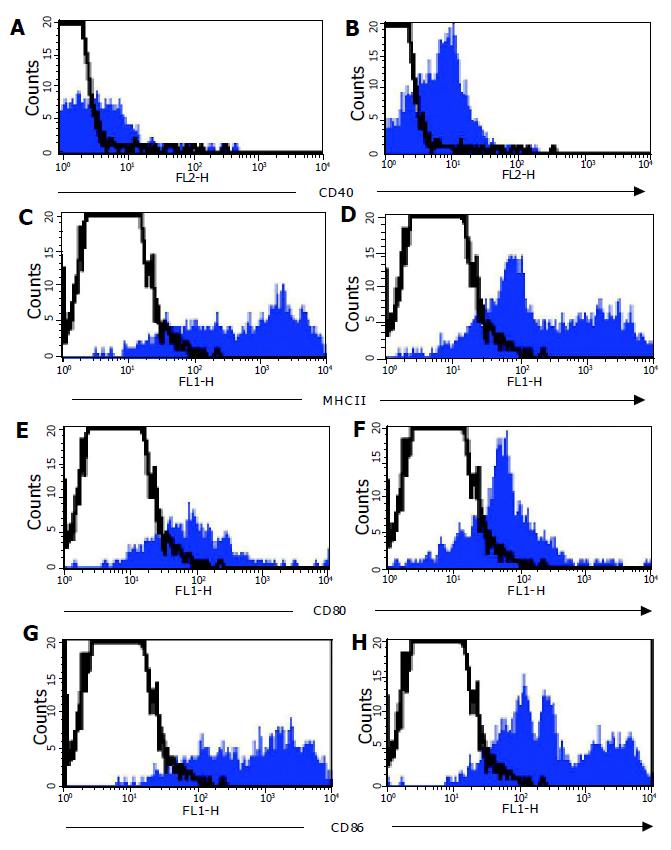
Figure 6 Co-stimulatory molecule expression on MLN DC.
Expression of CD40 (A+B), MHCII (C+D), CD80 (D+E) and CD86 (G+H) was analyzed on CD11c+ MLN DC from normal C57BL/6 (filled histograms left hand panel) and C57BL/6-IL2-/- (filled histograms right hand panel) mice by flow cytometry. Isotype control staining is represented by the open histograms with a dotted line. Data shown is a representative experiment from a total of six independent experiments.
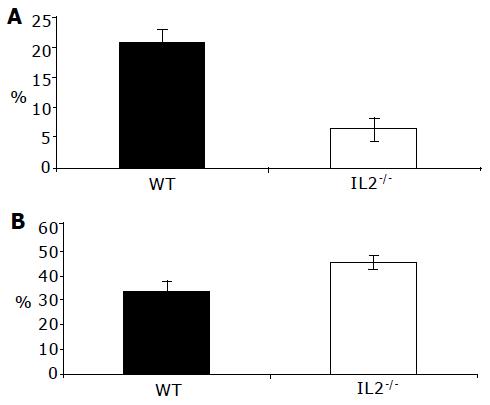
Figure 7 Increased endocytic activity by colonic DC from WT mice.
Endocytic uptake of colonic lamina propria cells was measured by incubating colonic LP cells with FITC-dextran and antibodies to identify CD11c+ DC (A) and F4/80+ macrophages (B) from normal C57BL/6 (WT) and colitic C57BL/6-IL2-/- (IL2-/-) mice. DC from colitic IL2-/- mice took up less FITC-dextran than their WT counterparts (P<0.001) consistent with them being mature DC. In contrast, colonic macrophages from IL2-/- mice took up more antigen than their WT counterparts although this was not significant (B). Results are from three independent experiments.
- Citation: Cruickshank SM, English NR, Felsburg PJ, Carding SR. Characterization of colonic dendritic cells in normal and colitic mice. World J Gastroenterol 2005; 11(40): 6338-6347
- URL: https://www.wjgnet.com/1007-9327/full/v11/i40/6338.htm
- DOI: https://dx.doi.org/10.3748/wjg.v11.i40.6338


