Copyright
©2005 Baishideng Publishing Group Inc.
World J Gastroenterol. Oct 28, 2005; 11(40): 6305-6311
Published online Oct 28, 2005. doi: 10.3748/wjg.v11.i40.6305
Published online Oct 28, 2005. doi: 10.3748/wjg.v11.i40.6305
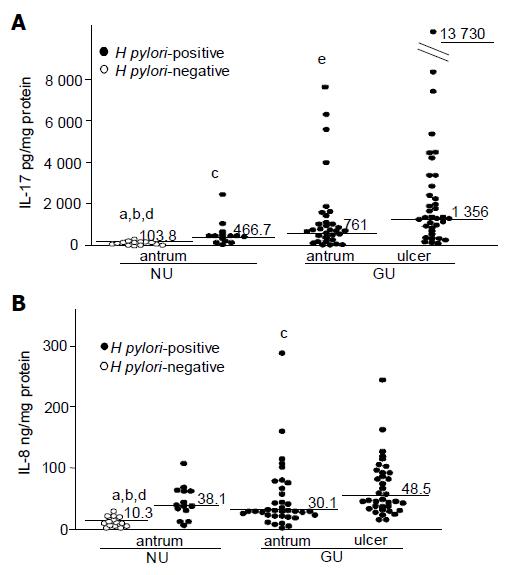
Figure 1 Levels of IL-17 (A) and IL-8 (B) secreted in organ cultures of biopsies from H pylori-positive (closed circle) and -negative (open circle) patients.
The bar indicates the median value for each group. A: aP<0.0005 a vs b, bP<0.0001 a vs c, cP<0.0005 b vs c,dP<0.0001 a vs d, eP<0.0005 c vs d; B: aP<0.0005 a vs b, bP<0.0001 a vs c, cP<0.0005 a vs d, dP<0.0001 a vs d (NS:not significant).
Figure 2 Relationship between IL-17 and IL-8 levels in biopsy culture supernatants from antrum (A) and ulcer site (B).
The bar indicates the median value for each group.
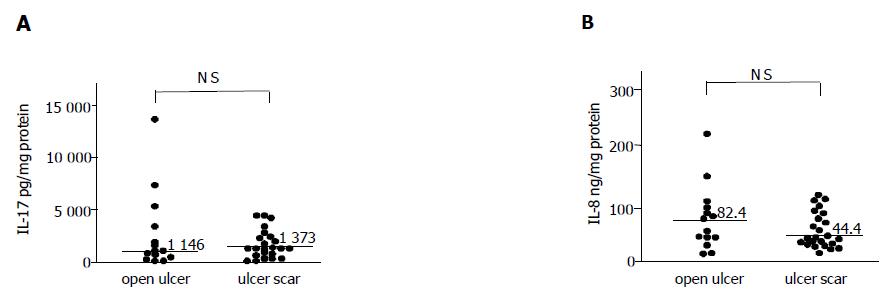
Figure 3 IL-17 (A) and IL-8 (B) levels in biopsy culture supernatants of GU patients according to ulcer stage.
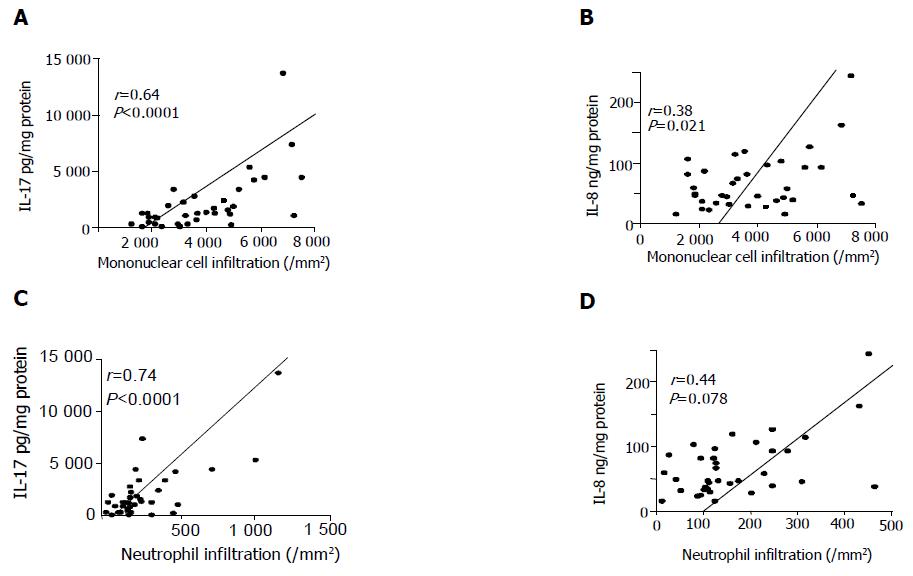
Figure 4 Relationship between IL-17 (A and C) or IL-8 (B and D) levels and mononuclear cell infiltration or neutrophil infiltration at ulcer sites.
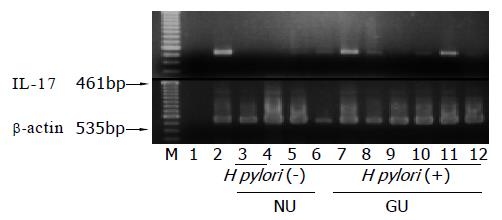
Figure 5 RT-PCR analysis of IL-17 and β-actin mRNA.
M: 100-bp ladder marker; lane 1: negative (no cDNA sample); lane 2: positive control (PBMC stimulated by PHA for 3 h); lanes 3 and 4: antral biopsies from H pylori-negative NU patients with endoscopically normal mucosa; lanes 5 and 6: antral biopsies from H pylori-positive NU patients with gastritis; lanes 7, 9, and 11: antral biopsies from H pylori-positive GU patients; lanes 8, 10, and 12: mucosal biopsies from the ulcer site of H pylori-positive GU patients.
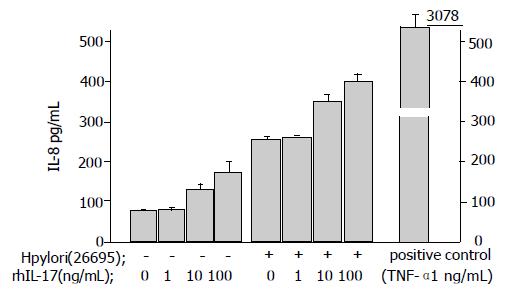
Figure 6 IL-8 levels in culture supernatants of AGS cells co-cultured with graded doses of rhIL-17, H pylori strain 26 695, or both.
-
Citation: Mizuno T, Ando T, Nobata K, Tsuzuki T, Maeda O, Watanabe O, Minami M, Ina K, Kusugami K, Peek RM, Goto H. Interleukin-17 levels in
Helicobacter pylori -infected gastric mucosa and pathologic sequelae of colonization. World J Gastroenterol 2005; 11(40): 6305-6311 - URL: https://www.wjgnet.com/1007-9327/full/v11/i40/6305.htm
- DOI: https://dx.doi.org/10.3748/wjg.v11.i40.6305


