Copyright
©2005 Baishideng Publishing Group Inc.
World J Gastroenterol. Jan 28, 2005; 11(4): 529-533
Published online Jan 28, 2005. doi: 10.3748/wjg.v11.i4.529
Published online Jan 28, 2005. doi: 10.3748/wjg.v11.i4.529
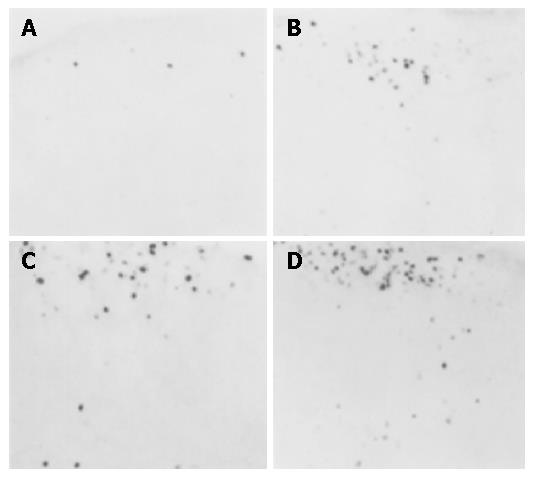
Figure 1 c-fos expression in the cervical cord.
A: Control group; B: 3 mo model group; C: 4 mo model group; D: 5 mo model group. There were only a few c-fos expressions in the cervical cord of the control group, but increased c-fos expression was seen in the model groups 3, 4 and 5 mo after the operation.
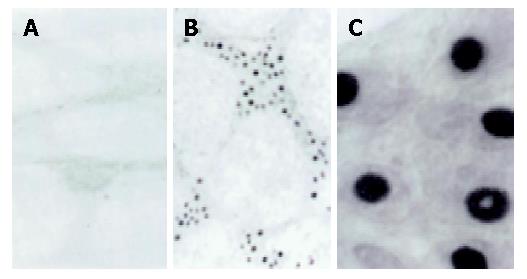
Figure 2 c-Fos expression in gastric antram.
A: Control group; B: Model group; C: Enlarged figure of the model group; neurons were defined as c-fos positive when the nucleus was stained with intensity clearly above the faint background stain, whereas neurons were defined as c-fos negative when the nucleus was either not stained at all or stained with intensity closed to background stain.
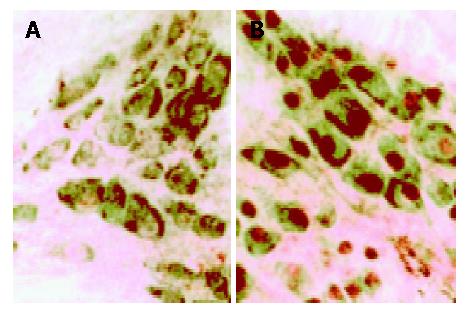
Figure 3 Color photomicrographs of flat sections of gastric wall showing nuclear c-fos labeling in neurons of myenteric plexus.
A: Control group; B: Model group. The cytoplasm of antral neurons was counterstained with cuprolinic blue to assess total number of neurons. Fos-positive neurons were expressed as a percentage of the positive cells in total number.
- Citation: Song PS, Kong KM, Niu CY, Qi WL, Wu LF, Wang XJ, Han W, Huang K, Chen ZF. Expression of c-fos in gastric myenteric plexus and spinal cord of rats with cervical spondylosis. World J Gastroenterol 2005; 11(4): 529-533
- URL: https://www.wjgnet.com/1007-9327/full/v11/i4/529.htm
- DOI: https://dx.doi.org/10.3748/wjg.v11.i4.529


