Copyright
©2005 Baishideng Publishing Group Inc.
World J Gastroenterol. Jan 28, 2005; 11(4): 503-507
Published online Jan 28, 2005. doi: 10.3748/wjg.v11.i4.503
Published online Jan 28, 2005. doi: 10.3748/wjg.v11.i4.503
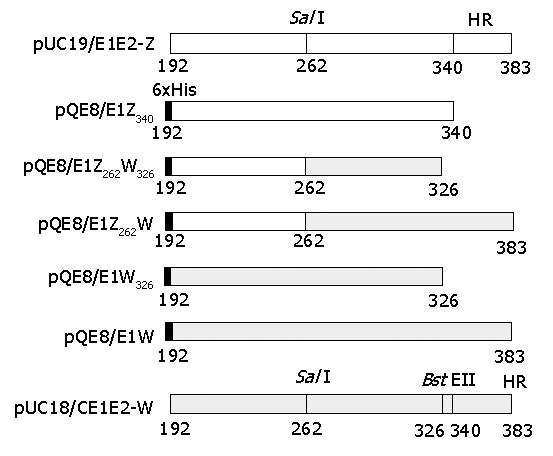
Figure 1 Schematic representation of E1 fragments selected for 6xHis fusion expression.
The original E1 coding sequences from two subtype 1b isolate cDNA plasmids are aligned at the top and bottom, respectively. Numbers indicate positions on the HCV polyprotein. Positions of restriction endonuclease recognition sites used for cloning are also shown. HR: hydrophobic region.
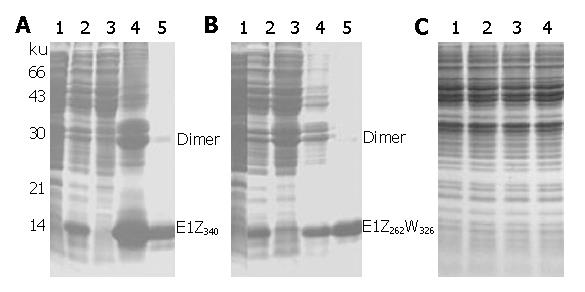
Figure 2 Expression and purification of E1 fragments in E.
coli Samples analyzed on standard reductive SDS-PAGE followed by Coomassie Brilliant Blue staining. (A) and (B): expression and purification of E1Z340 and E1Z262W326N. Lane 1: induced TG-1(pQE8) as negative control; lane 2: whole-cell sample after induction; lane 3: soluble fraction after sonication; lane 4: insoluble fraction after sonication; lane 5: purified products. (C): whole-cell samples of induced TG-1 carrying pQE8 (lane 1), pQE8/E1W (lane 2), pQE8/E1W326 (lane 3), and pQE8/E1Z262W, respectively.
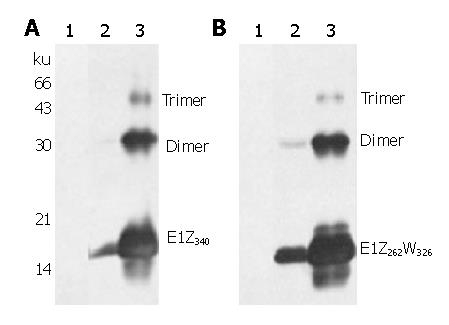
Figure 3 Specificity analysis of rabbit antisera against E.
coli-derived E1 proteins. Western blot analysis was carried out using (A) RE1Z340 and (B) RE1Z262W326N as primary antibody against (A) E1Z340 and (B) E1Z262W326N respectively. Lane 1: induced TG-1(pQE8) as negative control; lane 2: whole-cell sample after induction; lane 3: purified products.
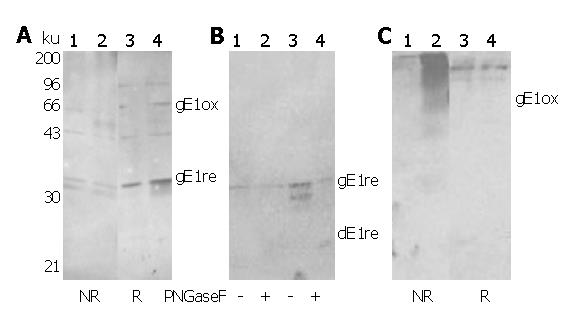
Figure 4 Detection of mammalian E1 glycoproteins using rabbit antisera against E.
coli-derived E1 proteins E1 glycoproteins expressed using recombinant vaccinia virus system were analyzed on standard SDS-PAGE followed by Western blot using RE1Z262W326R (A&B) and RE1Z262W326N (C) as primary antibody. In (A) and (C), lanes 1 and 3: HeLa cells infected with vvT7 alone; lanes 2 and 4: HeLa cells co-infected with vvT7 and vCEH-2. NR and R indicate non-reductive and reductive sample preparation, respectively. B: deglycosylation analysis of E1 glycoproteins using PNGase F. Lanes 1 and 2: HeLa cells infected with vvT7 alone; lanes 3 and 4: HeLa cells co-infected with vvT7 and vCEH-2. Positions of recognized E1 bands are indicated. Prefixed ‘g’ or ‘d’ indicates ‘glycosylated’ or ‘deglycosylated’ E1, respectively. Subscript ‘ox’ or ‘re’ indicates ‘oxidized’ or ‘reduced’ forms of E1, respectively.
-
Citation: Liu J, Zhu LX, Kong YY, Li GD, Wang Y. Purification and application of C-terminally truncated hepatitis C virus E1 proteins expressed in
Escherichia coli . World J Gastroenterol 2005; 11(4): 503-507 - URL: https://www.wjgnet.com/1007-9327/full/v11/i4/503.htm
- DOI: https://dx.doi.org/10.3748/wjg.v11.i4.503


