Copyright
©The Author(s) 2005.
World J Gastroenterol. Oct 21, 2005; 11(39): 6202-6207
Published online Oct 21, 2005. doi: 10.3748/wjg.v11.i39.6202
Published online Oct 21, 2005. doi: 10.3748/wjg.v11.i39.6202
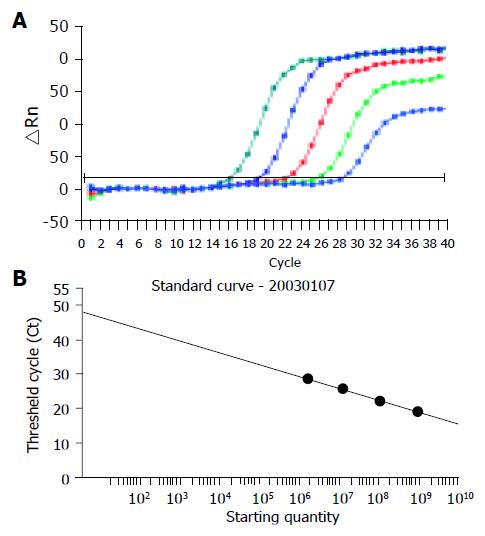
Figure 1 Representative real-time RT-PCR analysis for GAPDH mRNA copy levels.
A: Amplification plots of pGEM-T Easy/GAPDH cDNA; B: standard curve plotted against pGEM-T Easy/GAPDH cDNA copy number
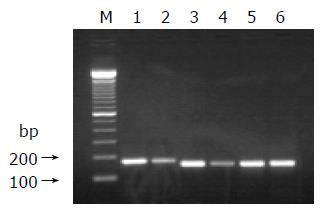
Figure 2 Expression of SNC19/matriptase and HAI-1 in gastric cancer tissue and its corresponding normal tissue (real-time RT-PCR products assay).
M: Marker (100-bp DNA ladder); lanes 1 and 2: SNC19/matriptase (168 bp); lanes 3 and 4: HAI-1 (151 bp); lanes 5 and 6: GAPDH (151 bp); lanes 1, 3 and 5: gastric normal tissues; lanes 2, 4, and 6: gastric cancer tissues. Figures in brackets indicate the sizes of real-time RT-PCR products
- Citation: Zeng L, Cao J, Zhang X. Expression of serine protease SNC19/matriptase and its inhibitor hepatocyte growth factor activator inhibitor type 1 in normal and malignant tissues of gastrointestinal tract. World J Gastroenterol 2005; 11(39): 6202-6207
- URL: https://www.wjgnet.com/1007-9327/full/v11/i39/6202.htm
- DOI: https://dx.doi.org/10.3748/wjg.v11.i39.6202


