Copyright
©The Author(s) 2005.
World J Gastroenterol. Oct 14, 2005; 11(38): 5920-5925
Published online Oct 14, 2005. doi: 10.3748/wjg.v11.i38.5920
Published online Oct 14, 2005. doi: 10.3748/wjg.v11.i38.5920
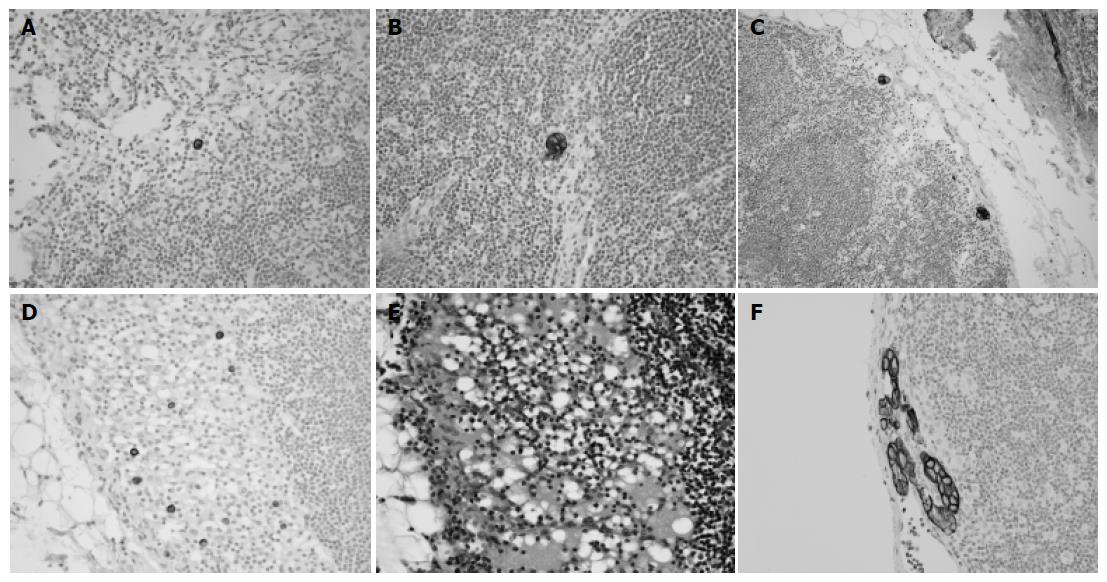
Figure 1 Immunohistochemical staining against cytokeratin.
A: Single cell only (×400); B: single small cluster (×400); C: multiple small clusters (×200); D: multiple individual cells (×400); E: HE-stained slides of multiple individual tumor cells in lymph nodes (the same area of D, ×400); F: micrometastasis (×400).
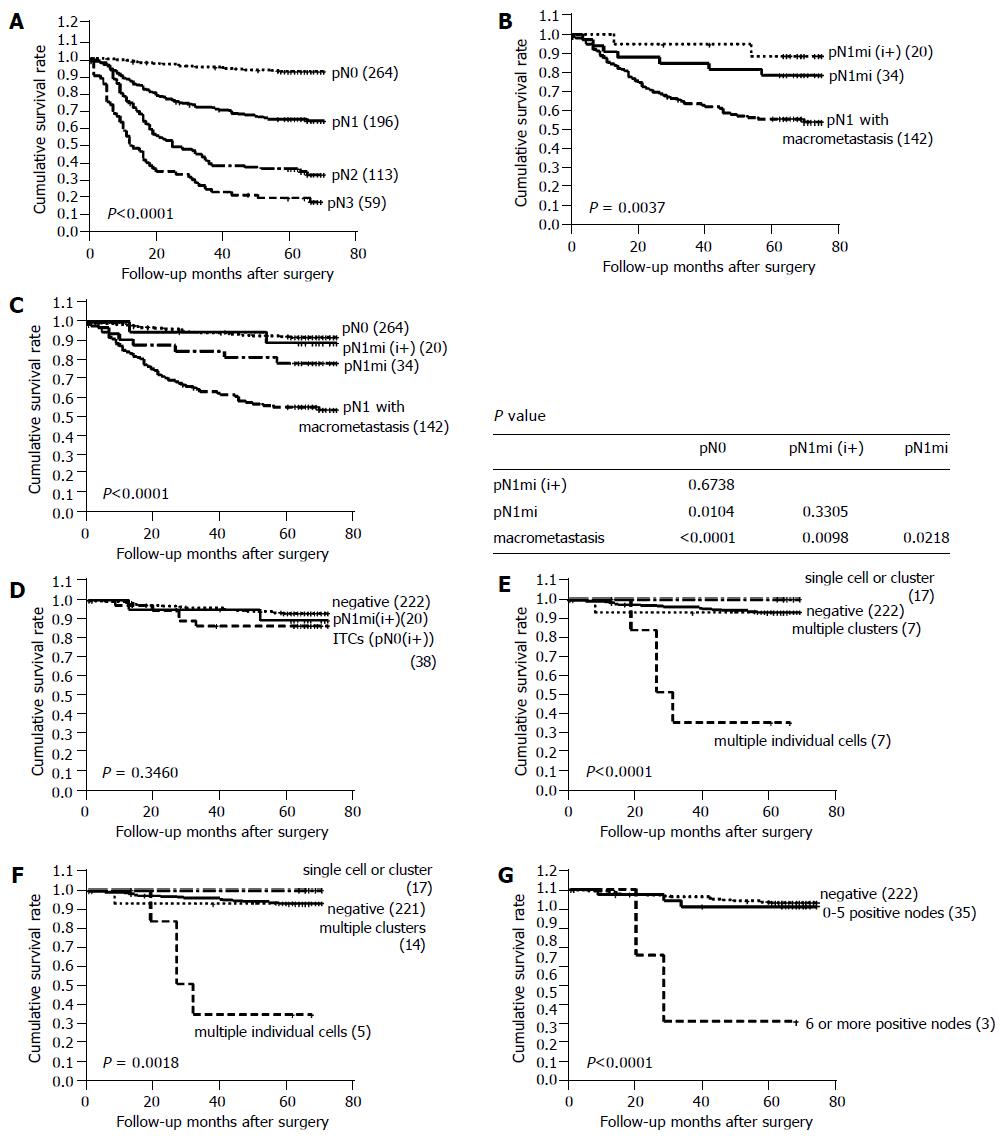
Figure 2 Survival curves using the Kaplan-Meier method.
A: Patient survival according to reclassified pN stage; B: survival curve of cases with pN1 with one or more macrometastases, pN1mi, and pN1mi(i+); C: survival curve of the cases with pN0 stage, pN1mi(i+), pN1mi, and pN1; D: prognostic impact of lymph node metastases as detected by immunostaining; E: survival curves according to the pattern of ITCs; F: survival curves according to the pattern of ITCs deleting patients with stage IV disease; G: survival curves according to the number of positive nodes.
- Citation: Lee HS, Kim MA, Yang HK, Lee BL, Kim WH. Prognostic implication of isolated tumor cells and micrometastases in regional lymph nodes of gastric cancer. World J Gastroenterol 2005; 11(38): 5920-5925
- URL: https://www.wjgnet.com/1007-9327/full/v11/i38/5920.htm
- DOI: https://dx.doi.org/10.3748/wjg.v11.i38.5920


