Copyright
©The Author(s) 2005.
World J Gastroenterol. Oct 7, 2005; 11(37): 5882-5887
Published online Oct 7, 2005. doi: 10.3748/wjg.v11.i37.5882
Published online Oct 7, 2005. doi: 10.3748/wjg.v11.i37.5882
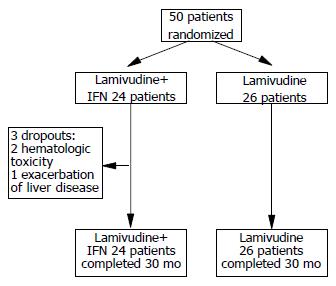
Figure 1 Outline of the trial
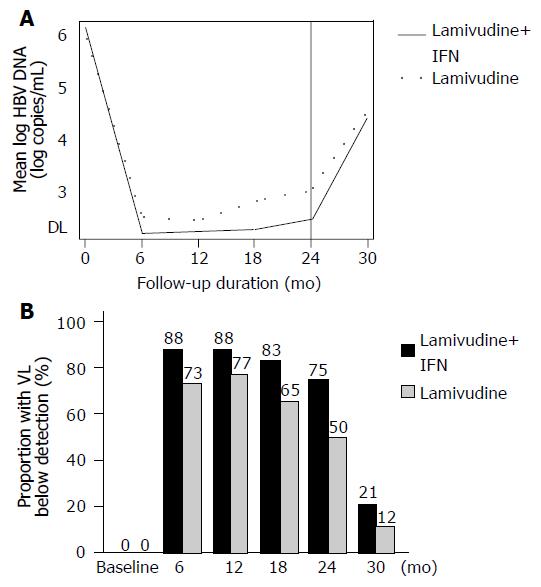
Figure 2 Virological course.
A: Treatment was administered up to 24 mo (vertical line). The trajectories of the mean log HBV DNA viral load are similar between the two groups. The following 6 mo were the follow-up period. B: Proportion of patients with viral load below detection (by ITT). DL: Detection limit; IFN: Interferon-α; mo: months; VL: HBV DNA viral load concentrations.
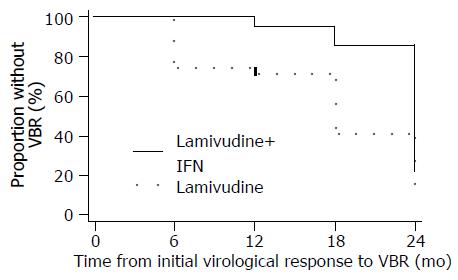
Figure 3 Combination treatment delayed the VBR compared to lamivudine monotherapy among patients who had lowered their HBV DNA concentrations below detection.
IFN: Interferon-α.
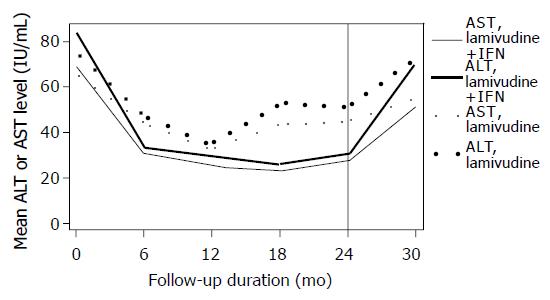
Figure 4 Biochemical course.
Mean transaminase levels per assessment time. Layout as per Figure 2. IFN: Interferon-α.
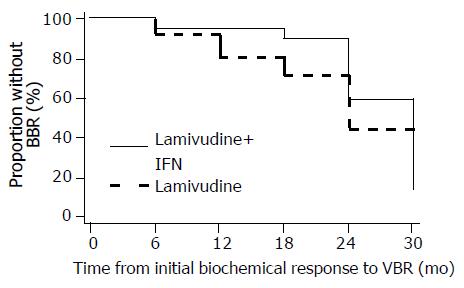
Figure 5 Combination therapy tended to delay BBR.
IFN: Interferon-α.
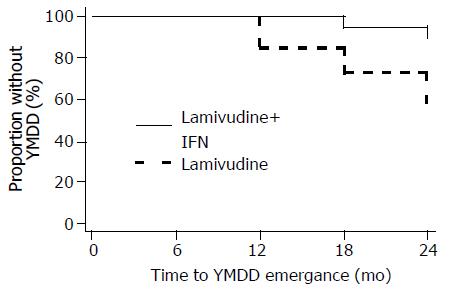
Figure 6 Time to YMDD emergence.
IFN: Interferon-α.
-
Citation: Economou M, Manolakopoulos S, Trikalinos TA, Filis S, Bethanis S, Tzourmakliotis D, Avgerinos A, Raptis S, Tsianos EV. Interferon-α plus lamivudine
vs lamivudine reduces breakthroughs, but does not affect sustained response in HBeAg negative chronic hepatitis B. World J Gastroenterol 2005; 11(37): 5882-5887 - URL: https://www.wjgnet.com/1007-9327/full/v11/i37/5882.htm
- DOI: https://dx.doi.org/10.3748/wjg.v11.i37.5882


